QuickStart Guide
Welcome to the SpiffWorkflow quick start guide!
👇 Throughout this step-by-step guide, we will walk you through key components of SpiffWorkflow, ensuring that you have a clear understanding of how to use the platform effectively.
🚀 Getting Started with SpiffArena
Sartography, the company that shepherds the SpiffWorkflow and SpiffArena projects, provides users with a platform to explore workflow concepts through a collection of examples, diagrams, and workflows. Users can interact with pre-built models, make modifications, and visualize process flows.
How to Log in to SpiffArena
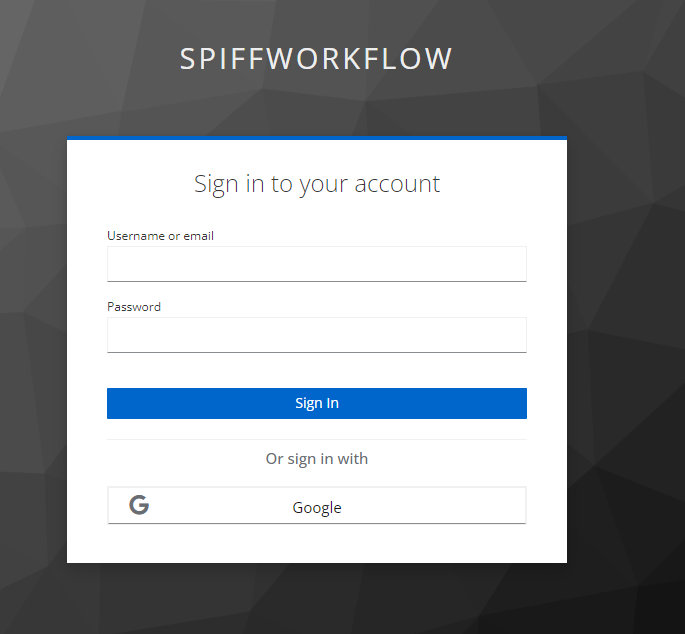
To begin your journey with SpiffArena, open your web browser and navigate to the SpiffArena website (currently spiffdemo.org).
On the login screen, you will find the option to log in using Single Sign-On. Click the Single Sign-On button and select your preferred login method, such as using your Gmail account.
Note:
Stay tuned as we expand our sign-on options beyond Gmail. More ways to access SpiffArena are coming your way!
How to Navigate through SpiffArena
This guide walks you through the updated SpiffWorkflow interface, highlighting its core sections, how to interact with workflows, and where to find key features for an improved user experience.
Home
The Home page is the default landing area after a user signs in to SpiffWorkflow.
It serves as the central dashboard for task management and platform orientation.
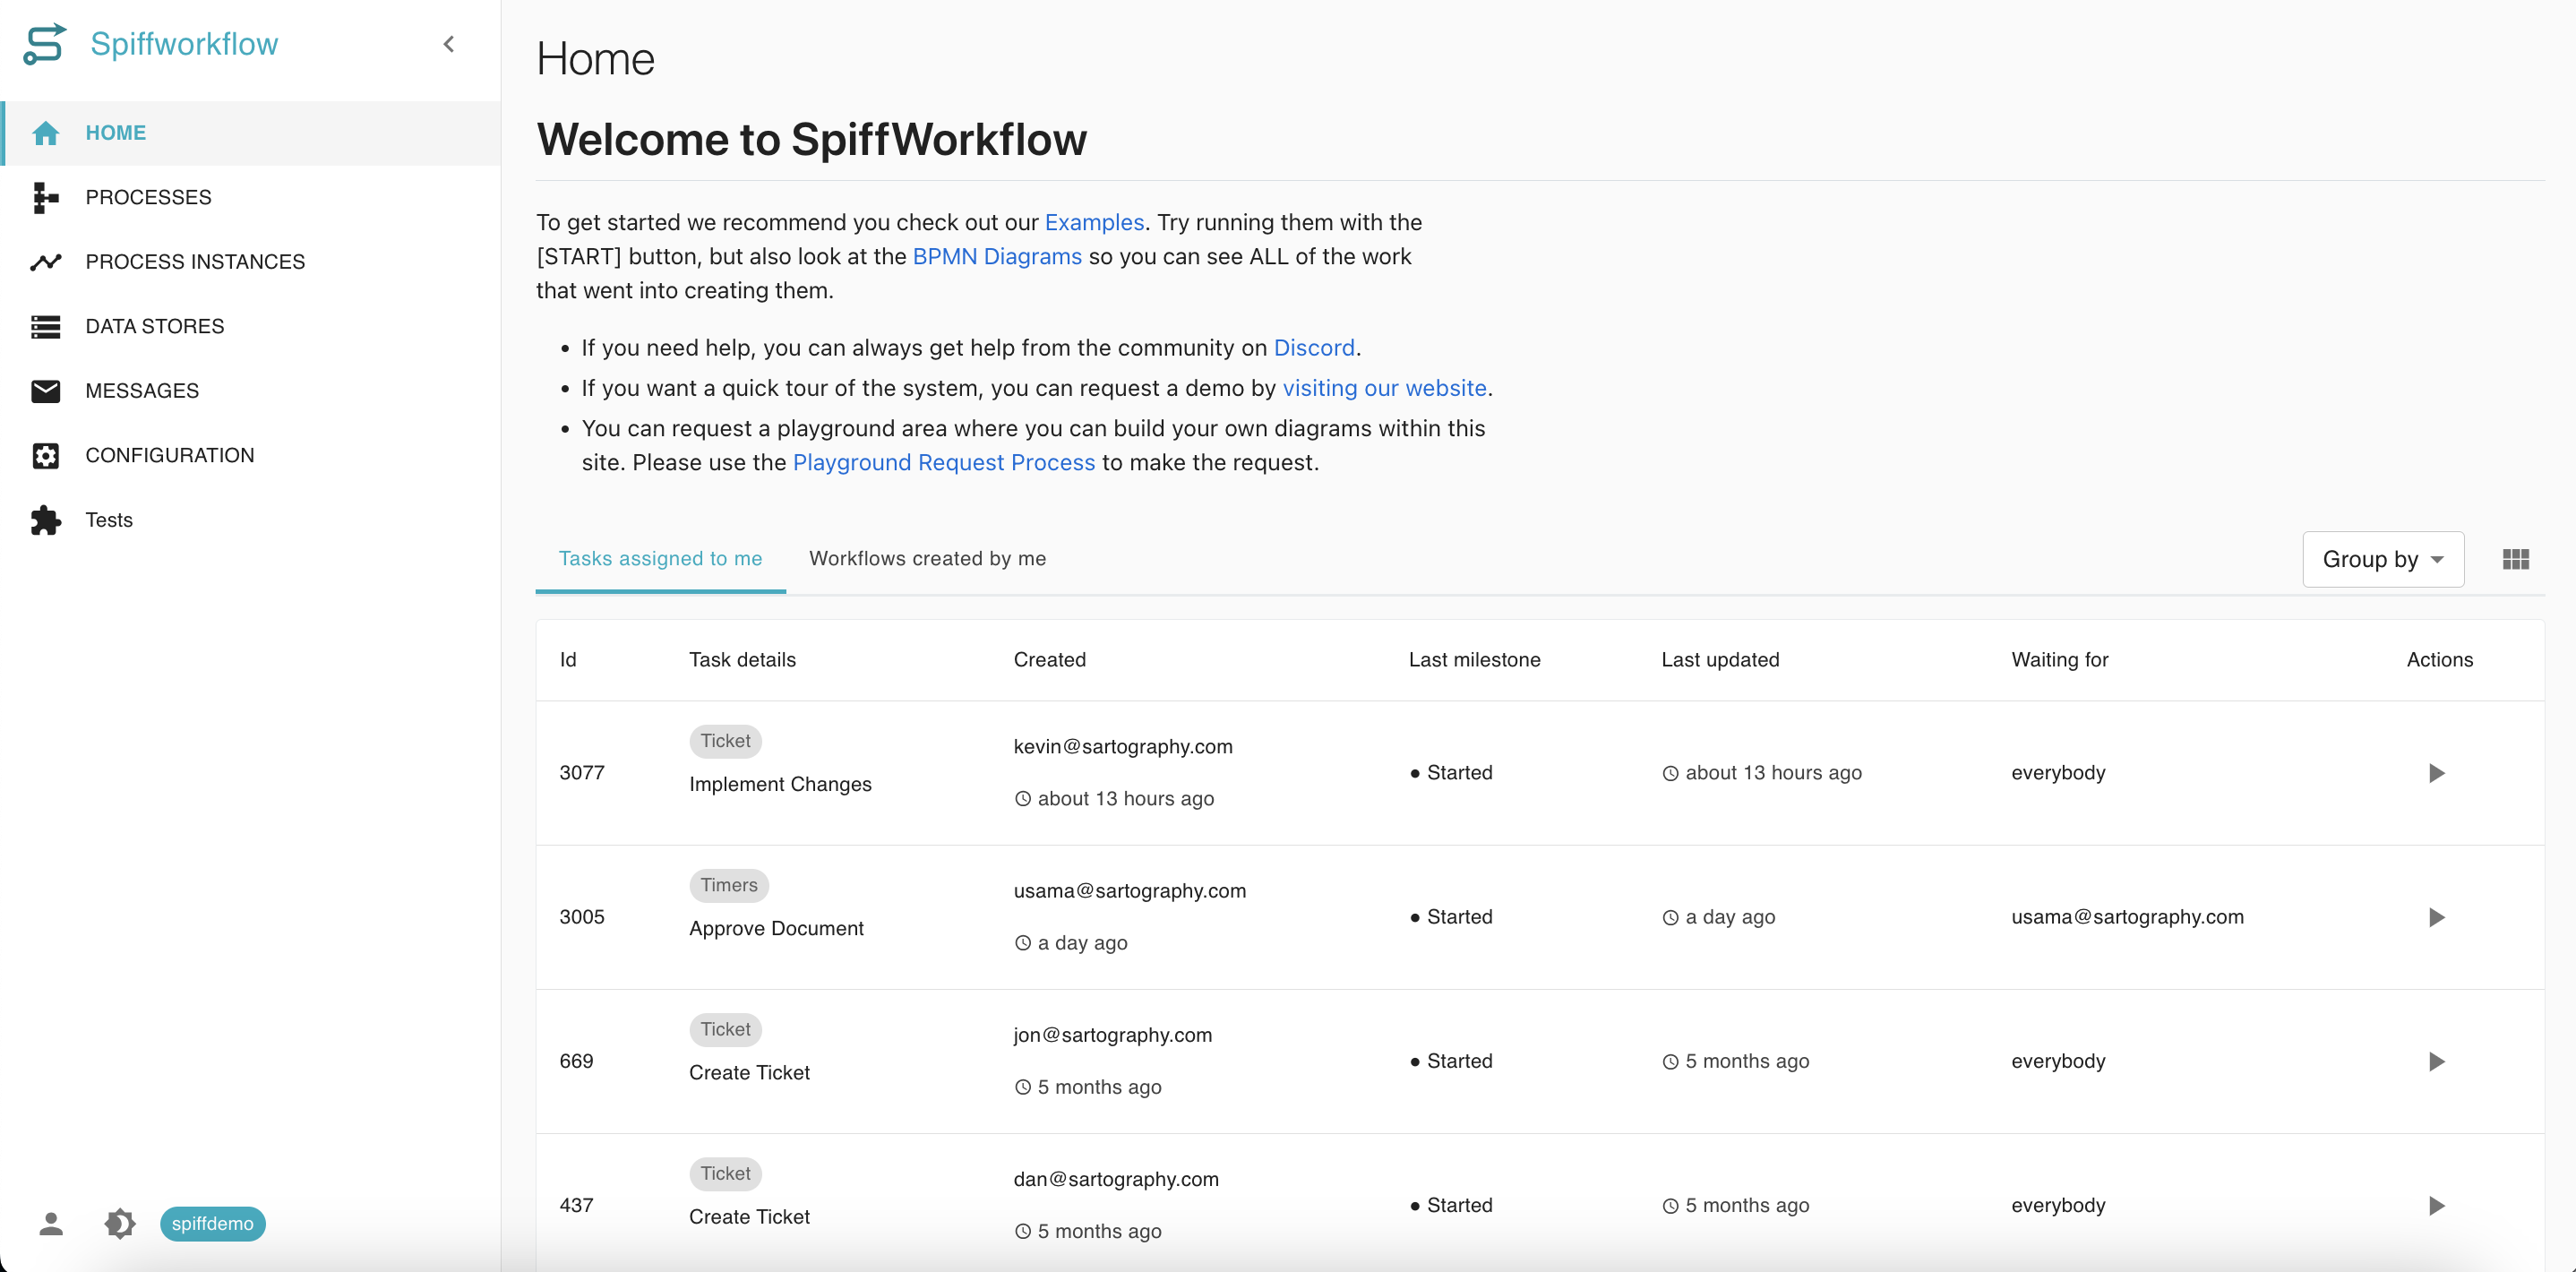
At the top of the Home page is a welcome message with important links and guidance for new users. Below the welcome panel are two tabs:
Tasks assigned to me: Displays all tasks that are currently awaiting input or action from the signed-in user. This includes the task ID, description, creator, timestamp, milestone (status), and who it’s waiting for. Users can click the play icon to proceed with the task.
Workflows created by me: Lists all workflows initiated by the user. It provides similar details, including task status and interaction options.
This task-focused layout allows users to quickly resume work or monitor the status of active process instances.
Processes
The Processes section provides an organized view of all available process models and groups. This is the primary interface for browsing, initiating, and managing workflow definitions.
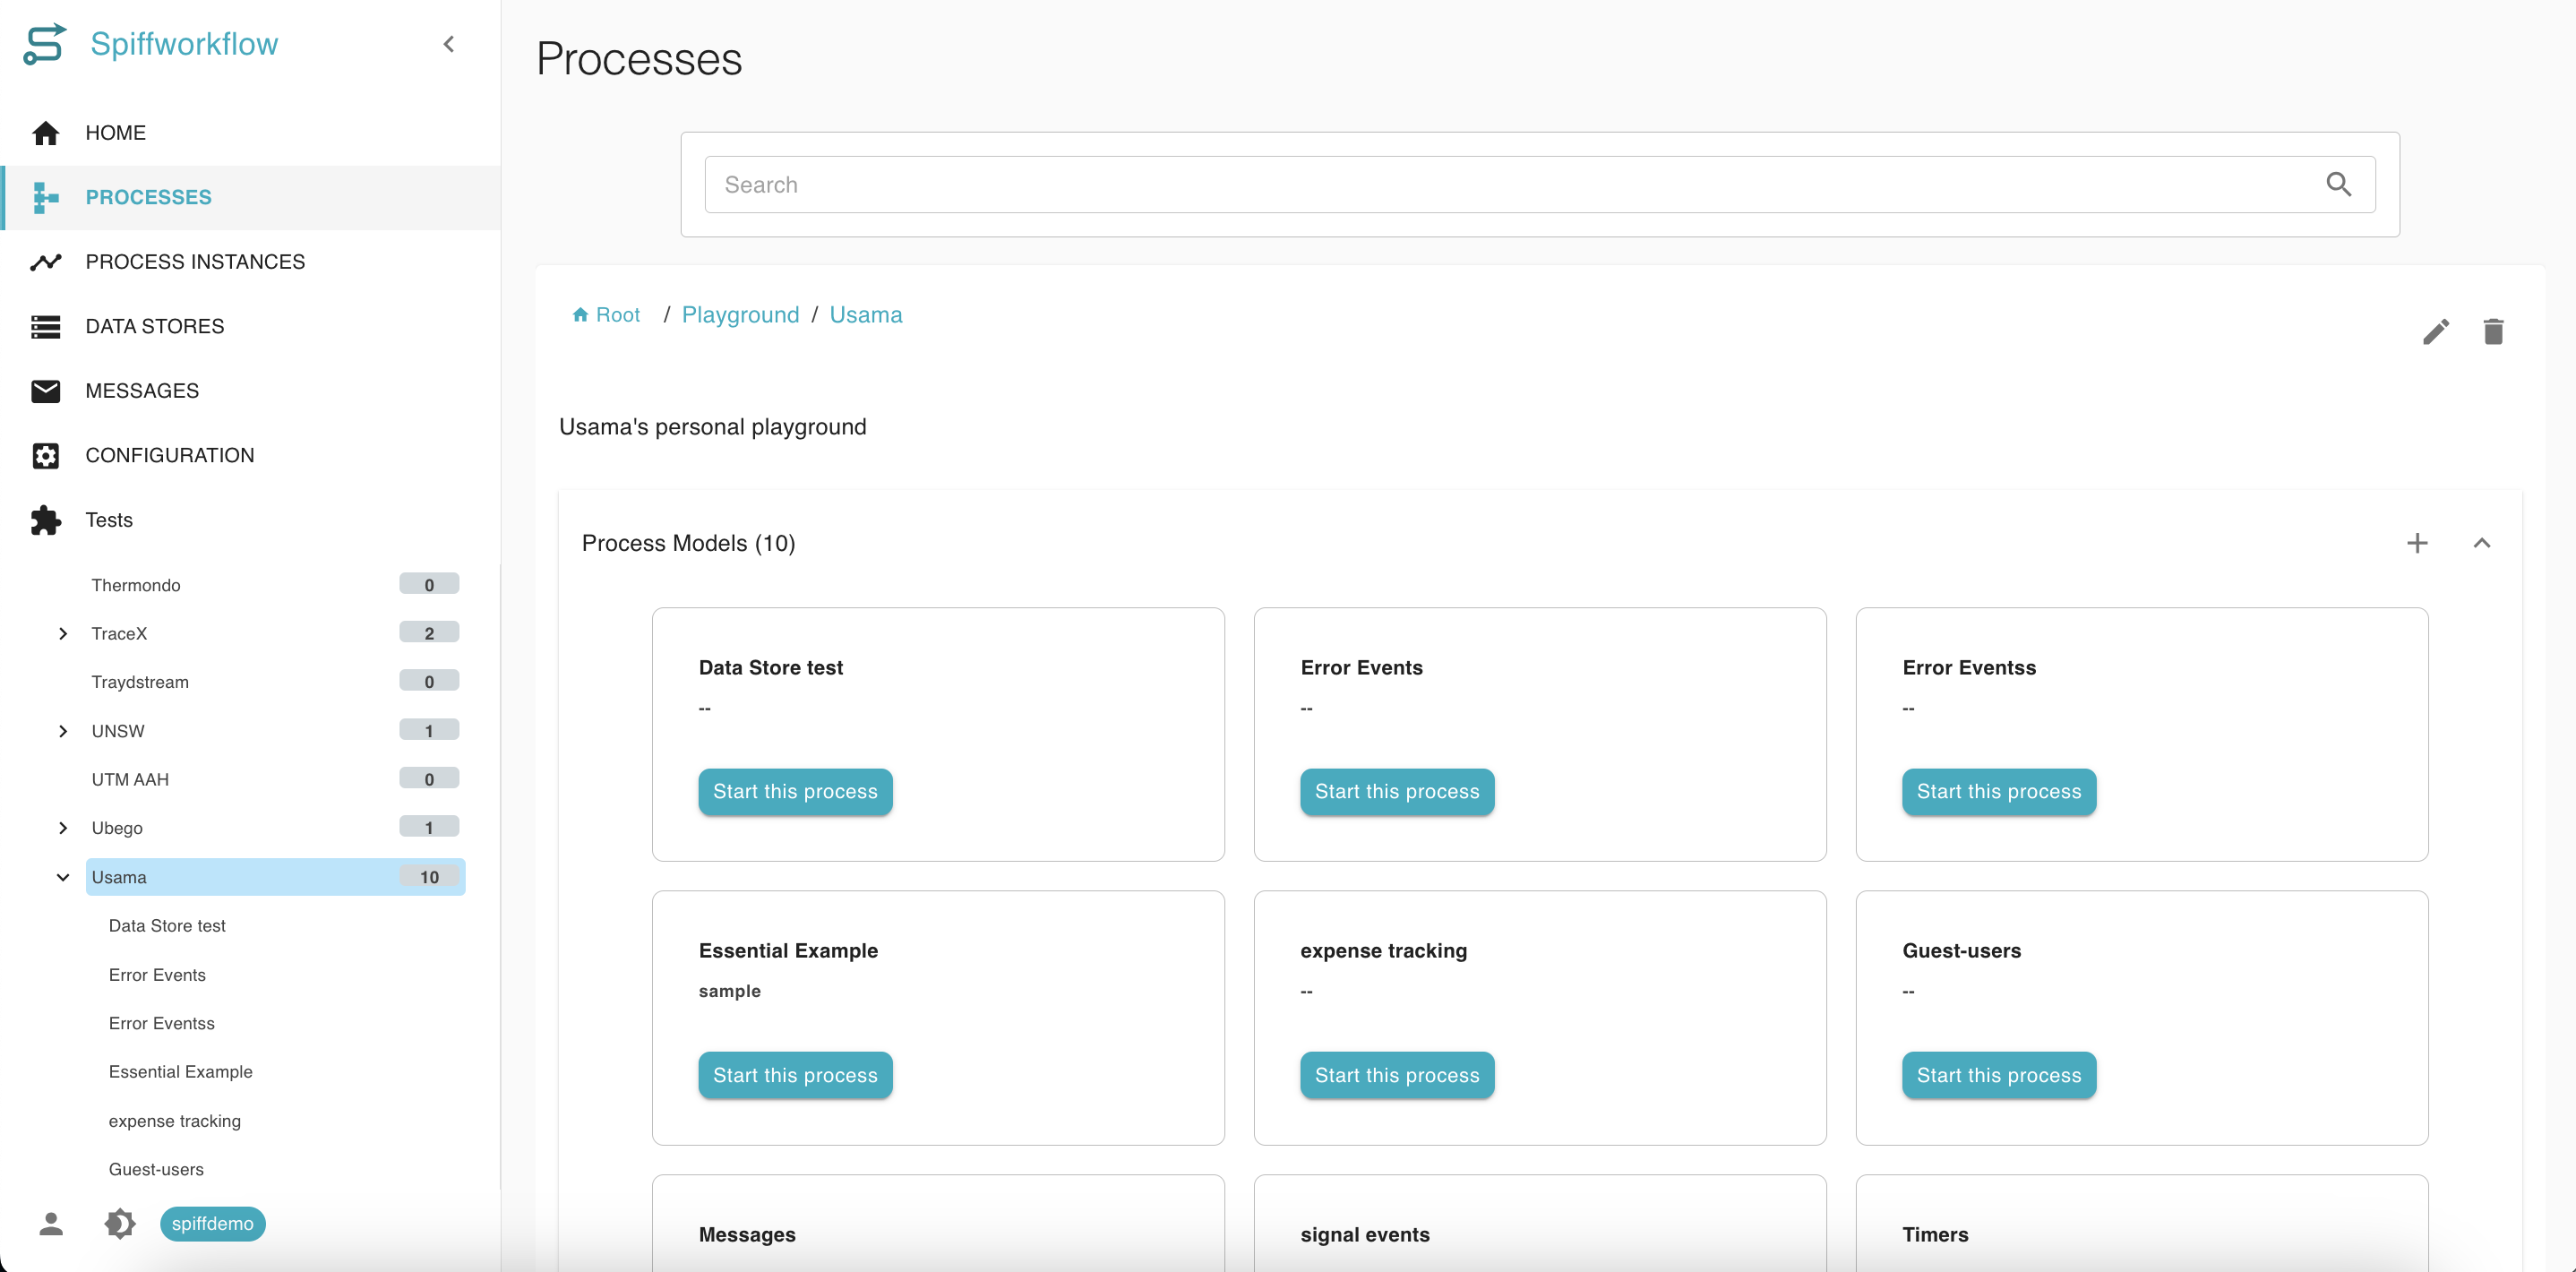
Here are the key components in processes section:
Process Models: These are individual BPMN-defined workflows. Each model represents a reusable process that can be instantiated multiple times.
Process Groups: A way to categorize related process models into logical folders (e.g., “Examples”, “Playground”, “Testing”). This helps users and administrators keep workflows organized.
Data Stores: These are data containers associated with workflows. Though accessible from the Processes section, they are more actively used within workflows to fetch or store data dynamically.
Process Groups
A process group is a way of grouping a bunch of process models, and a process model contains all the files necessary to execute a specific process.
This section is essential for users who want to explore what workflows are available or start a new instance of a process.
Process Instances
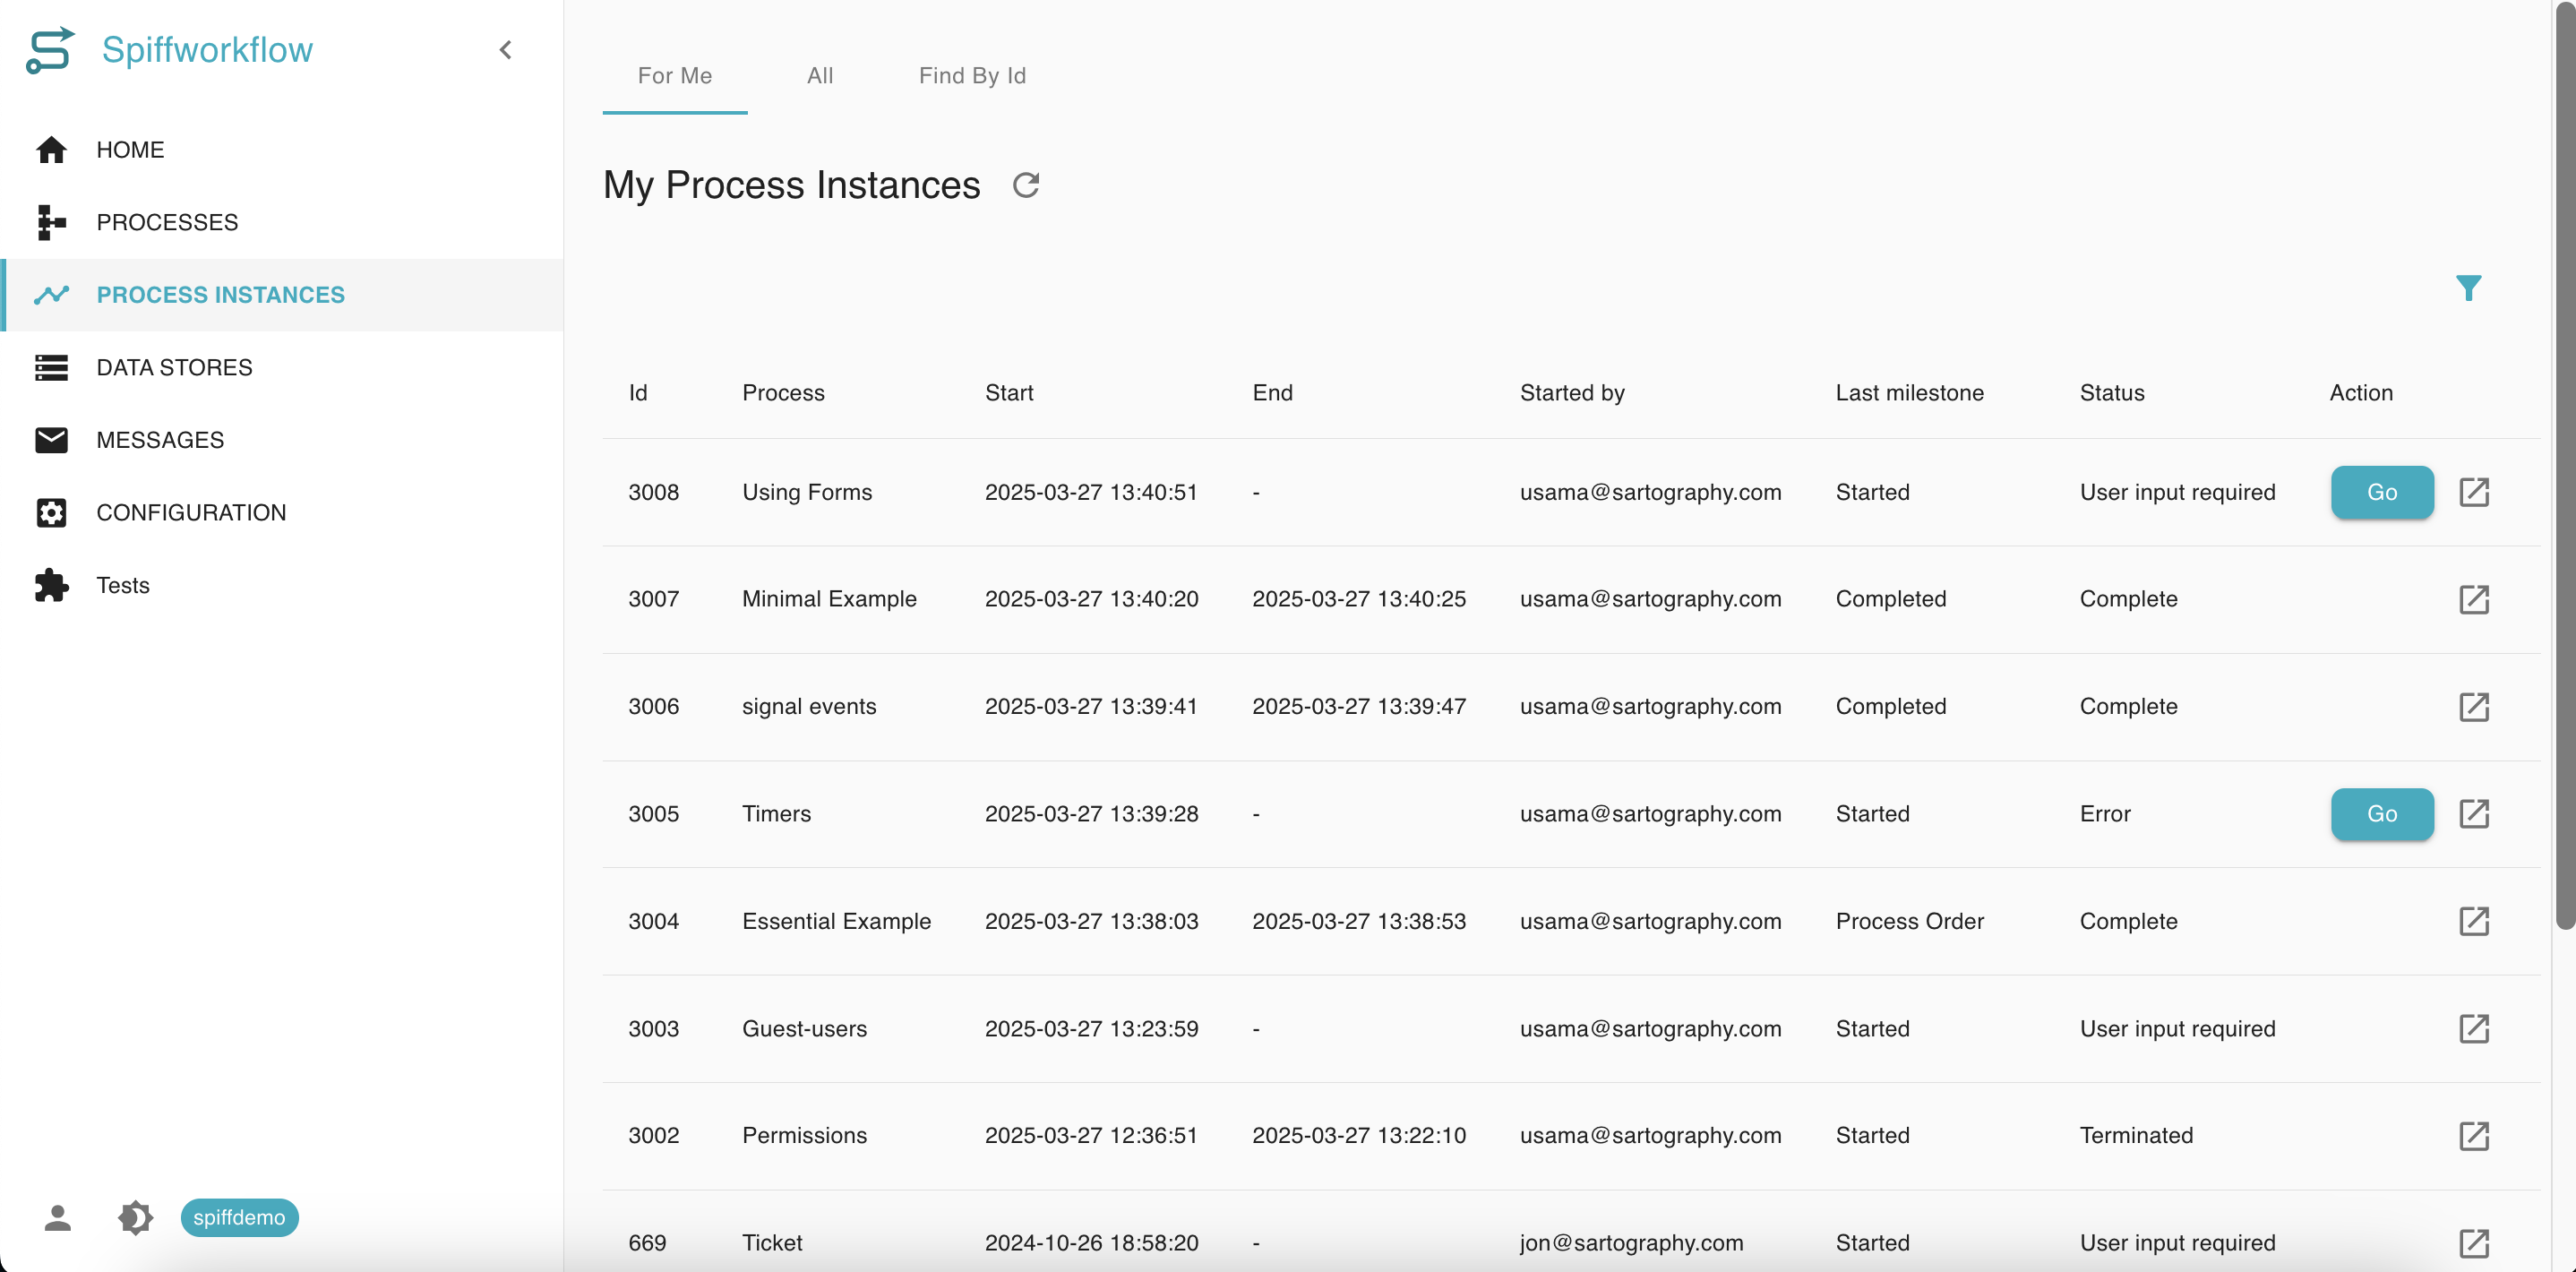
The Process Instances section provides insight into the execution of processes. It is where users can track the lifecycle and progress of workflow executions.
In the process instances, we have the following tabs:
For Me: Shows process instances that include tasks assigned to the current user.
All: Displays all process instances across the environment.
Find by ID: Allows users to search for a specific instance using its unique ID.
Each instance entry includes:
ID: A unique identifier for the instance.
Process: The name of the underlying process model.
Start and End: Timestamps for when the instance was initiated and, if applicable, completed.
Started by: The user who launched the process.
Last milestone: The current status of the workflow (e.g., “Started”, “Completed”).
Status: Indicates whether the instance requires input, is in progress, or is completed.
Action: An icon that opens the full instance view for detailed interaction.
This section is ideal for monitoring process health, checking workflow results, and managing running processes.
Key terms
💡 Process: A process is a sequence of tasks that must be completed to achieve a specific goal.
Instance: An instance, on the other hand, represents a specific occurrence of a process. Each instance has its own set of data and state that is updated as the instance progresses through the workflow.
Data Stores
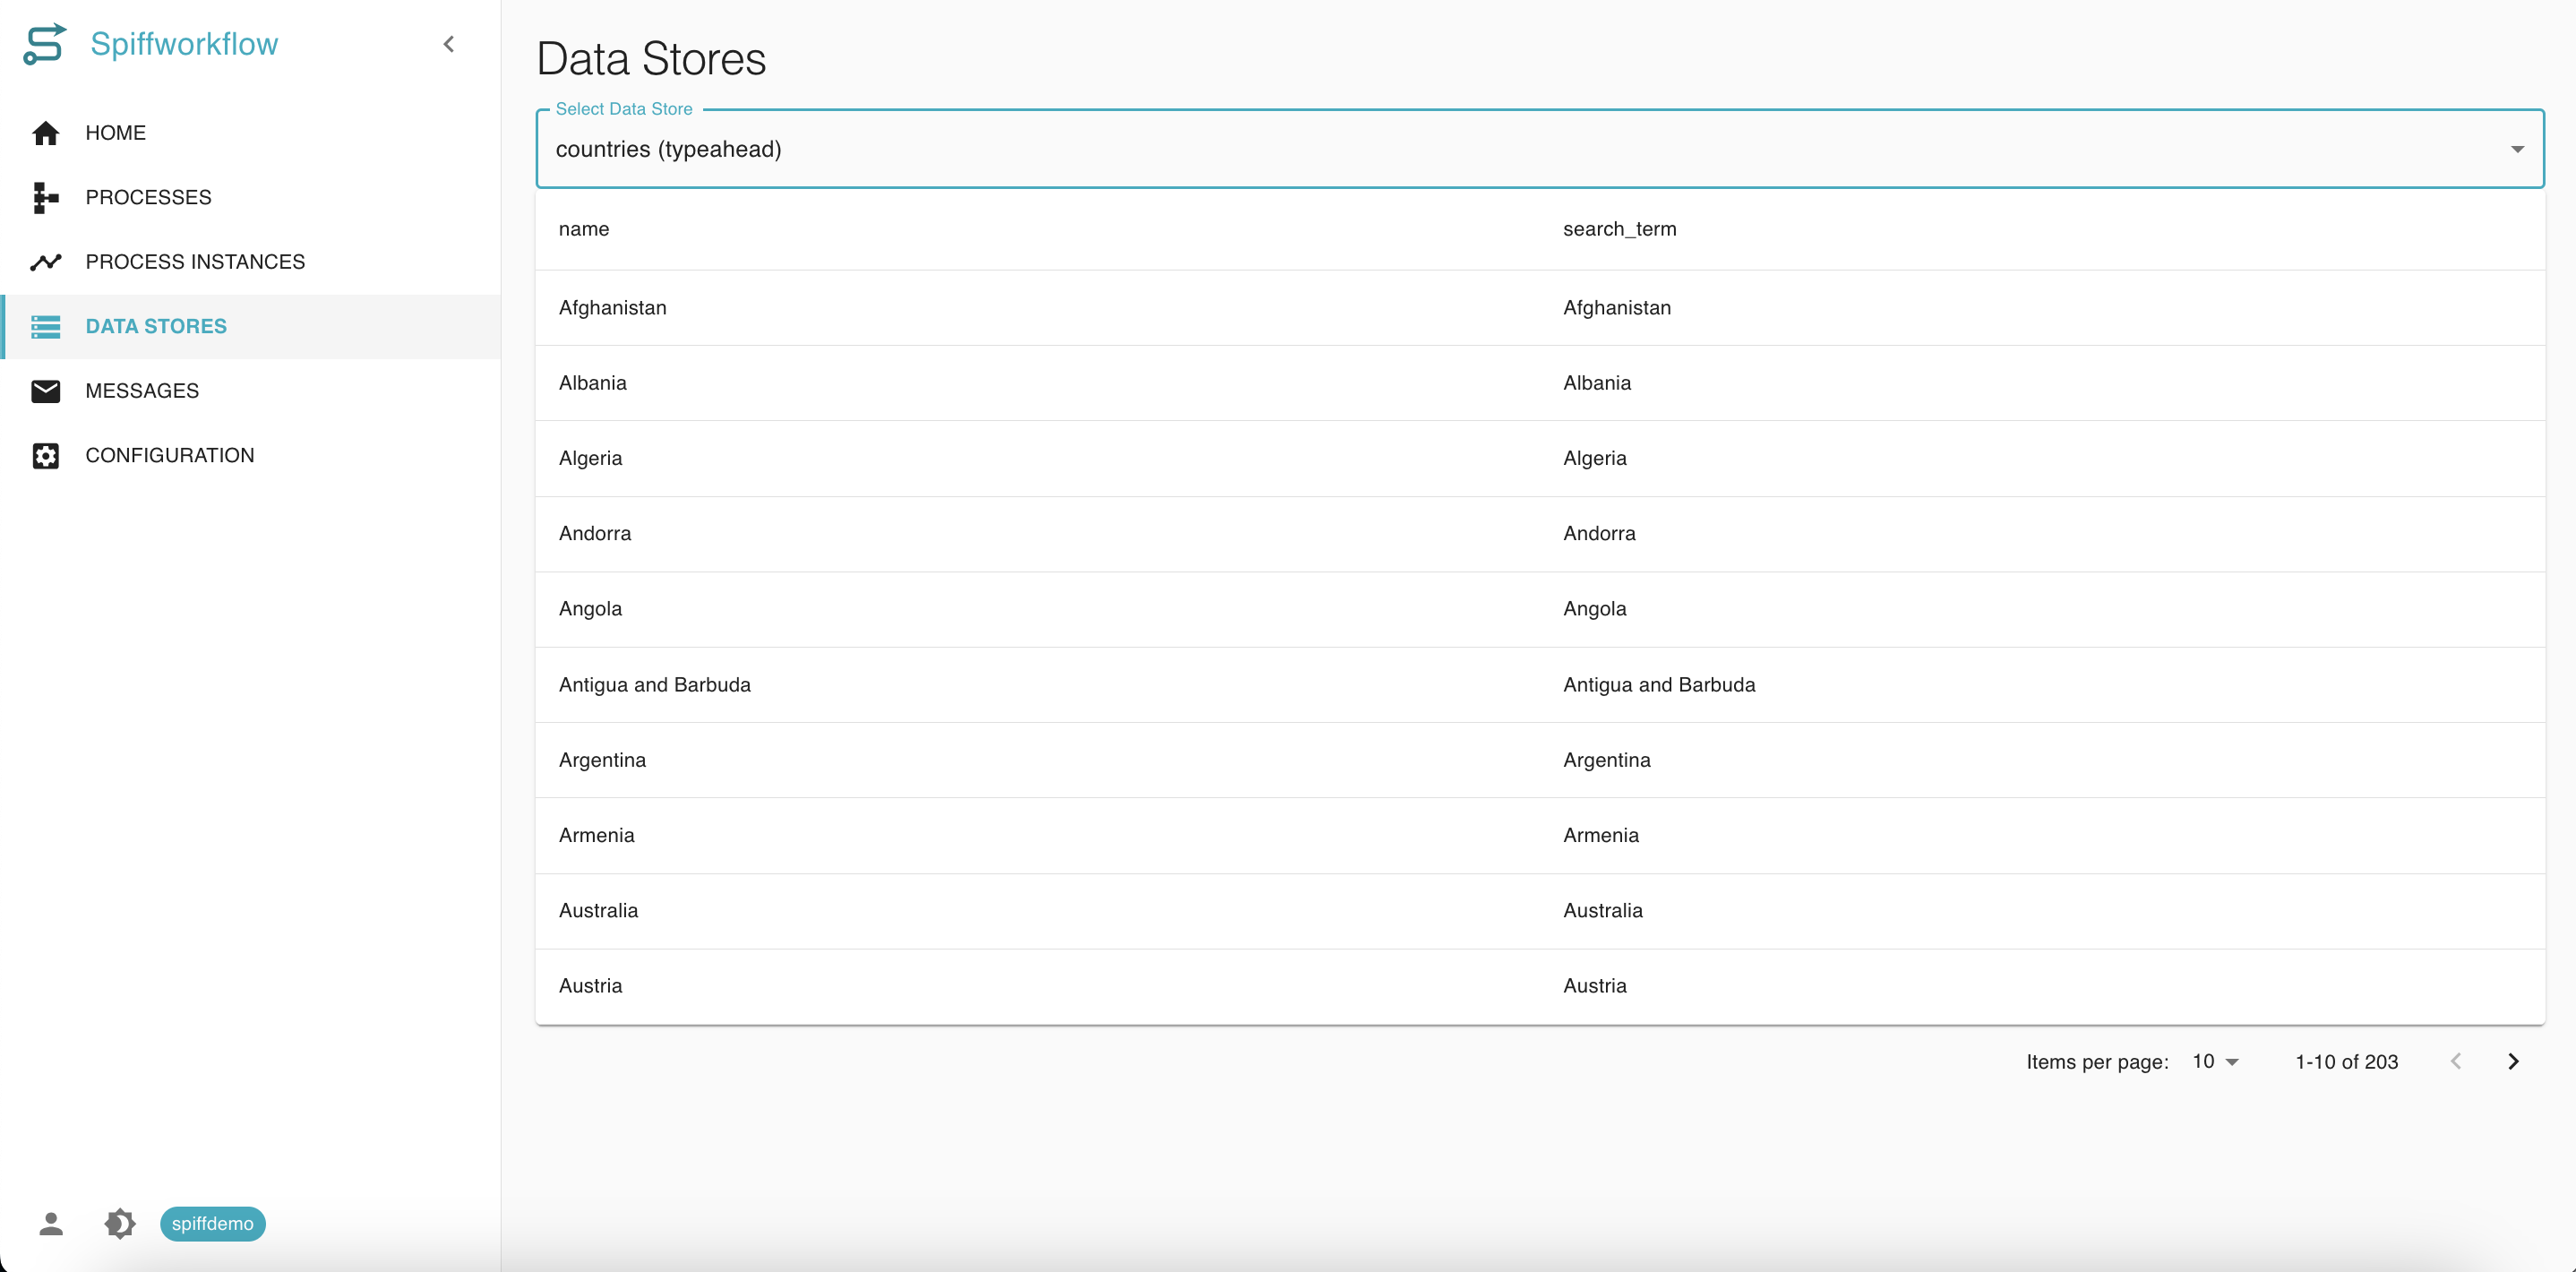
The Data Stores section enables interaction with datasets that can be used within workflows for dynamic data operations such as lookups, filtering, and decision-making.
A dropdown menu allows users to select a data store (e.g.,
countries).Once selected, the corresponding records are displayed in a searchable, paginated table.
Each entry typically contains fields such as
nameandsearch_term.
Data stores are often referenced in workflows to support logic branching, form population, and external API interactions.
Messages
The Messages section tracks all message events associated with processes, which is especially important in event-driven architectures or workflows with asynchronous behavior.
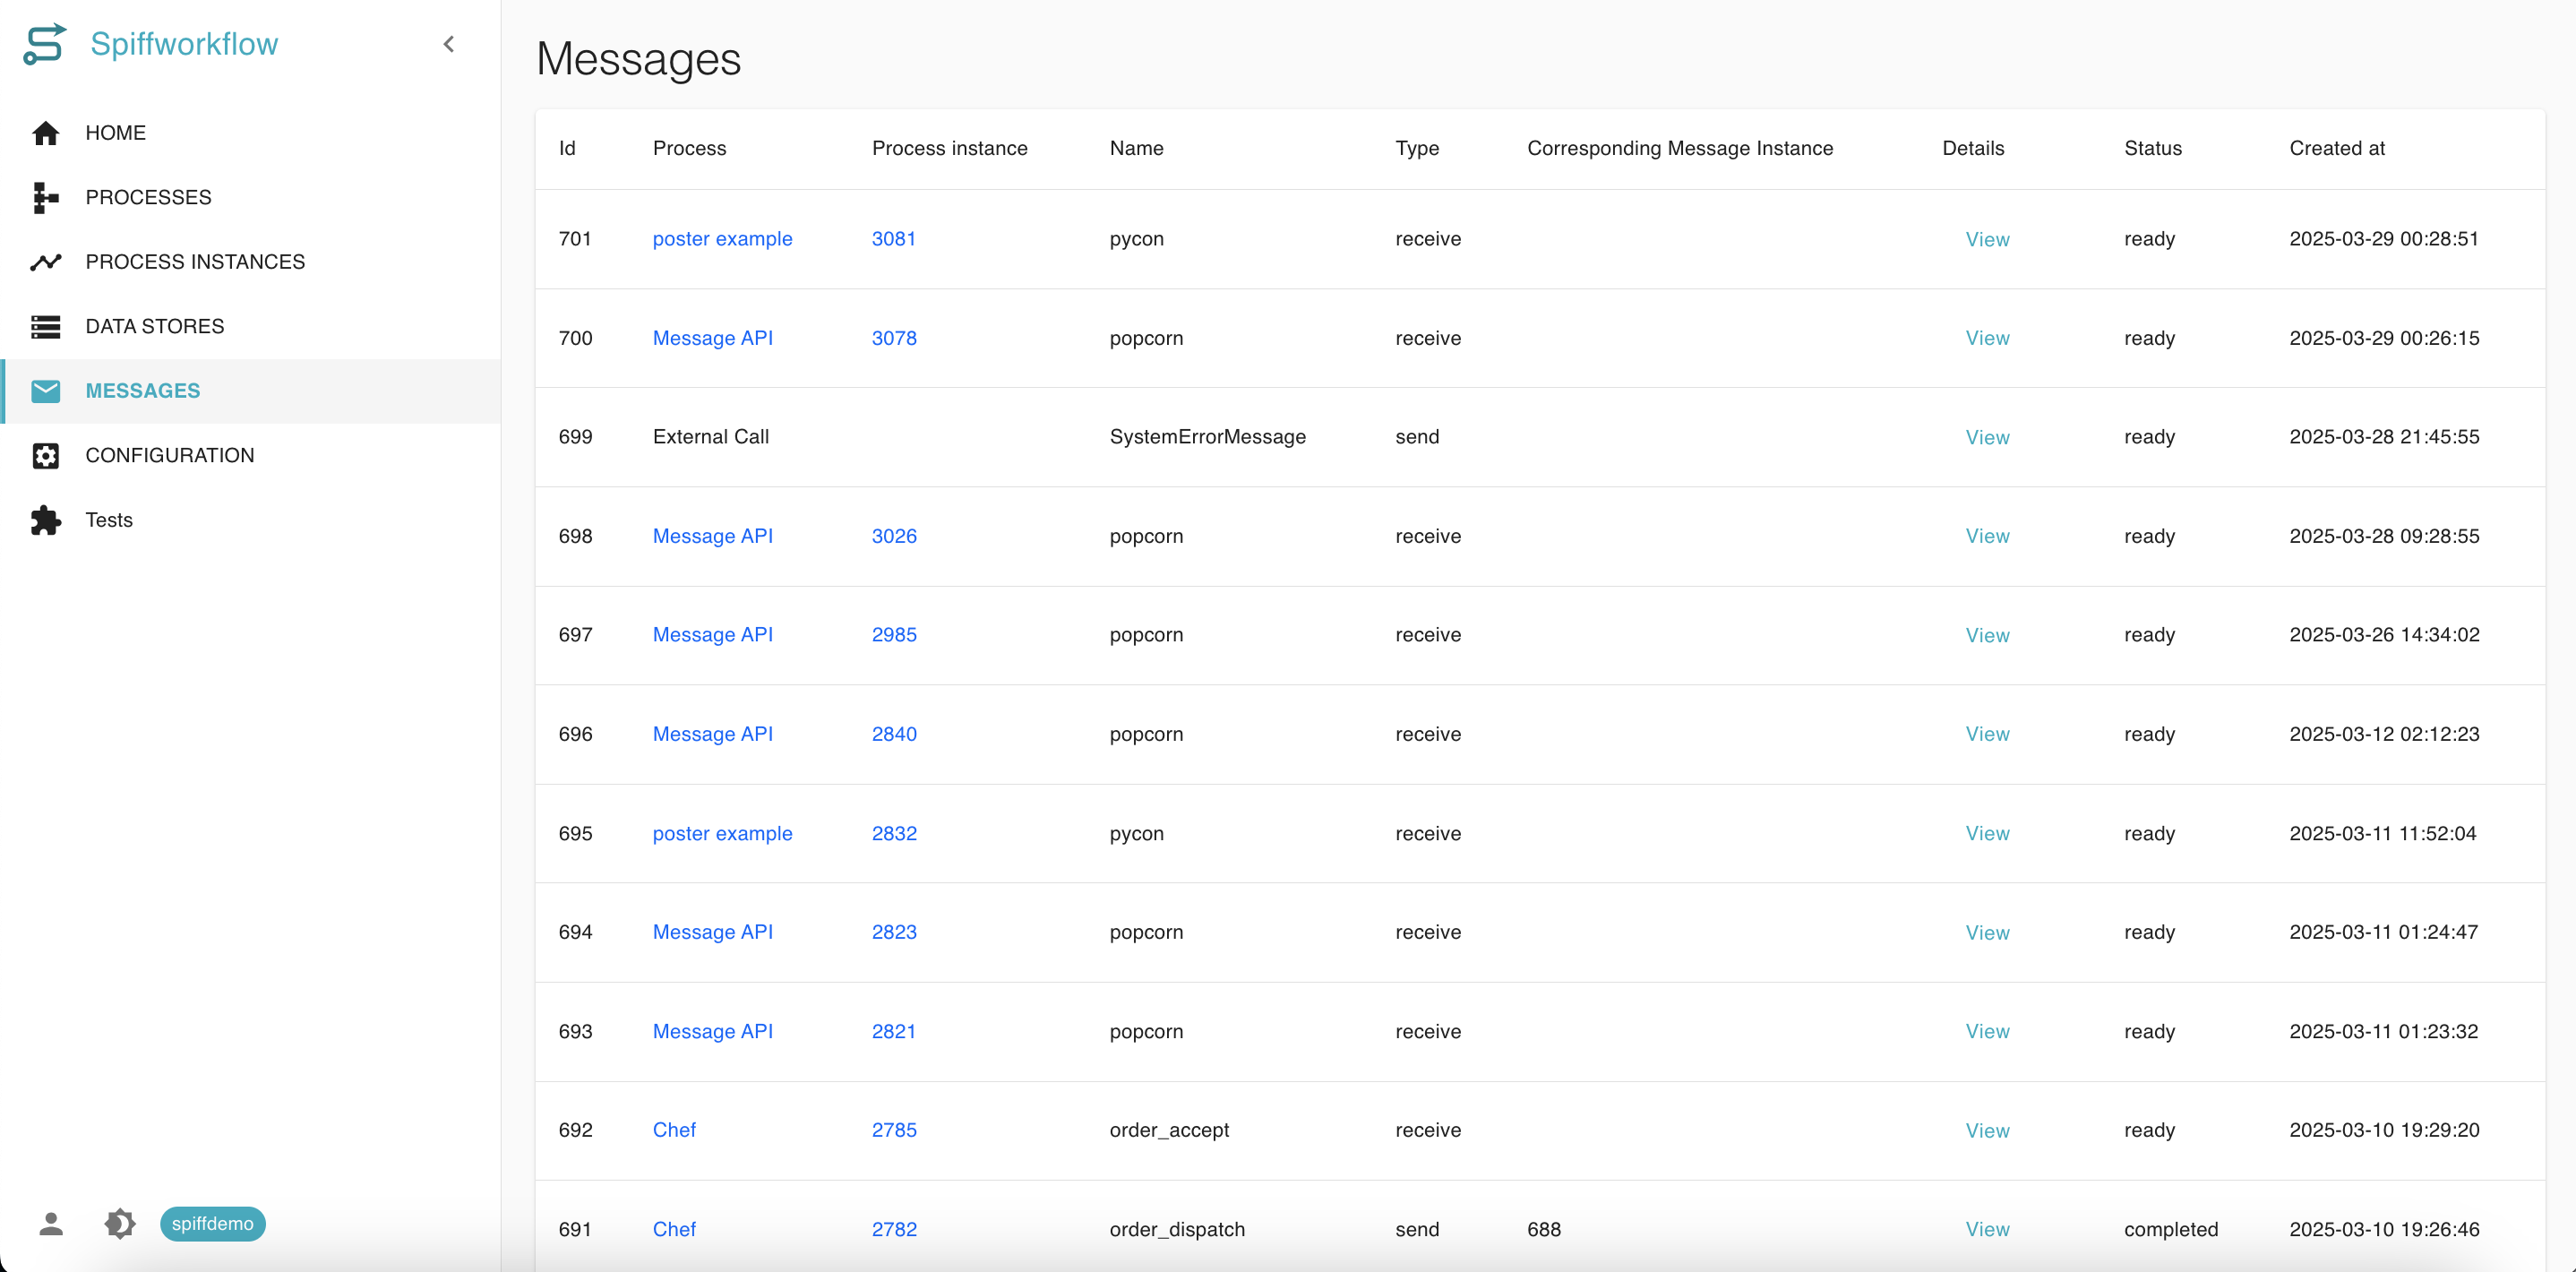
In the messages, we have the following table fields:
ID: The unique message ID.
Process and Process Instance: Links to the related workflow.
Name: The name of the message event.
Type: Indicates if the message is sent or received.
Corresponding Message Instance: References the matched message if applicable.
Details: A clickable link to view message payloads and metadata.
Status: The state of the message event (e.g.,
ready,completed).Created at: The timestamp of the event creation.
This section is essential for debugging message flows, especially in workflows using boundary events, intermediate events, or external integrations.
Configuration
The Configuration section enables system-level setup for secure data management and API authentication.
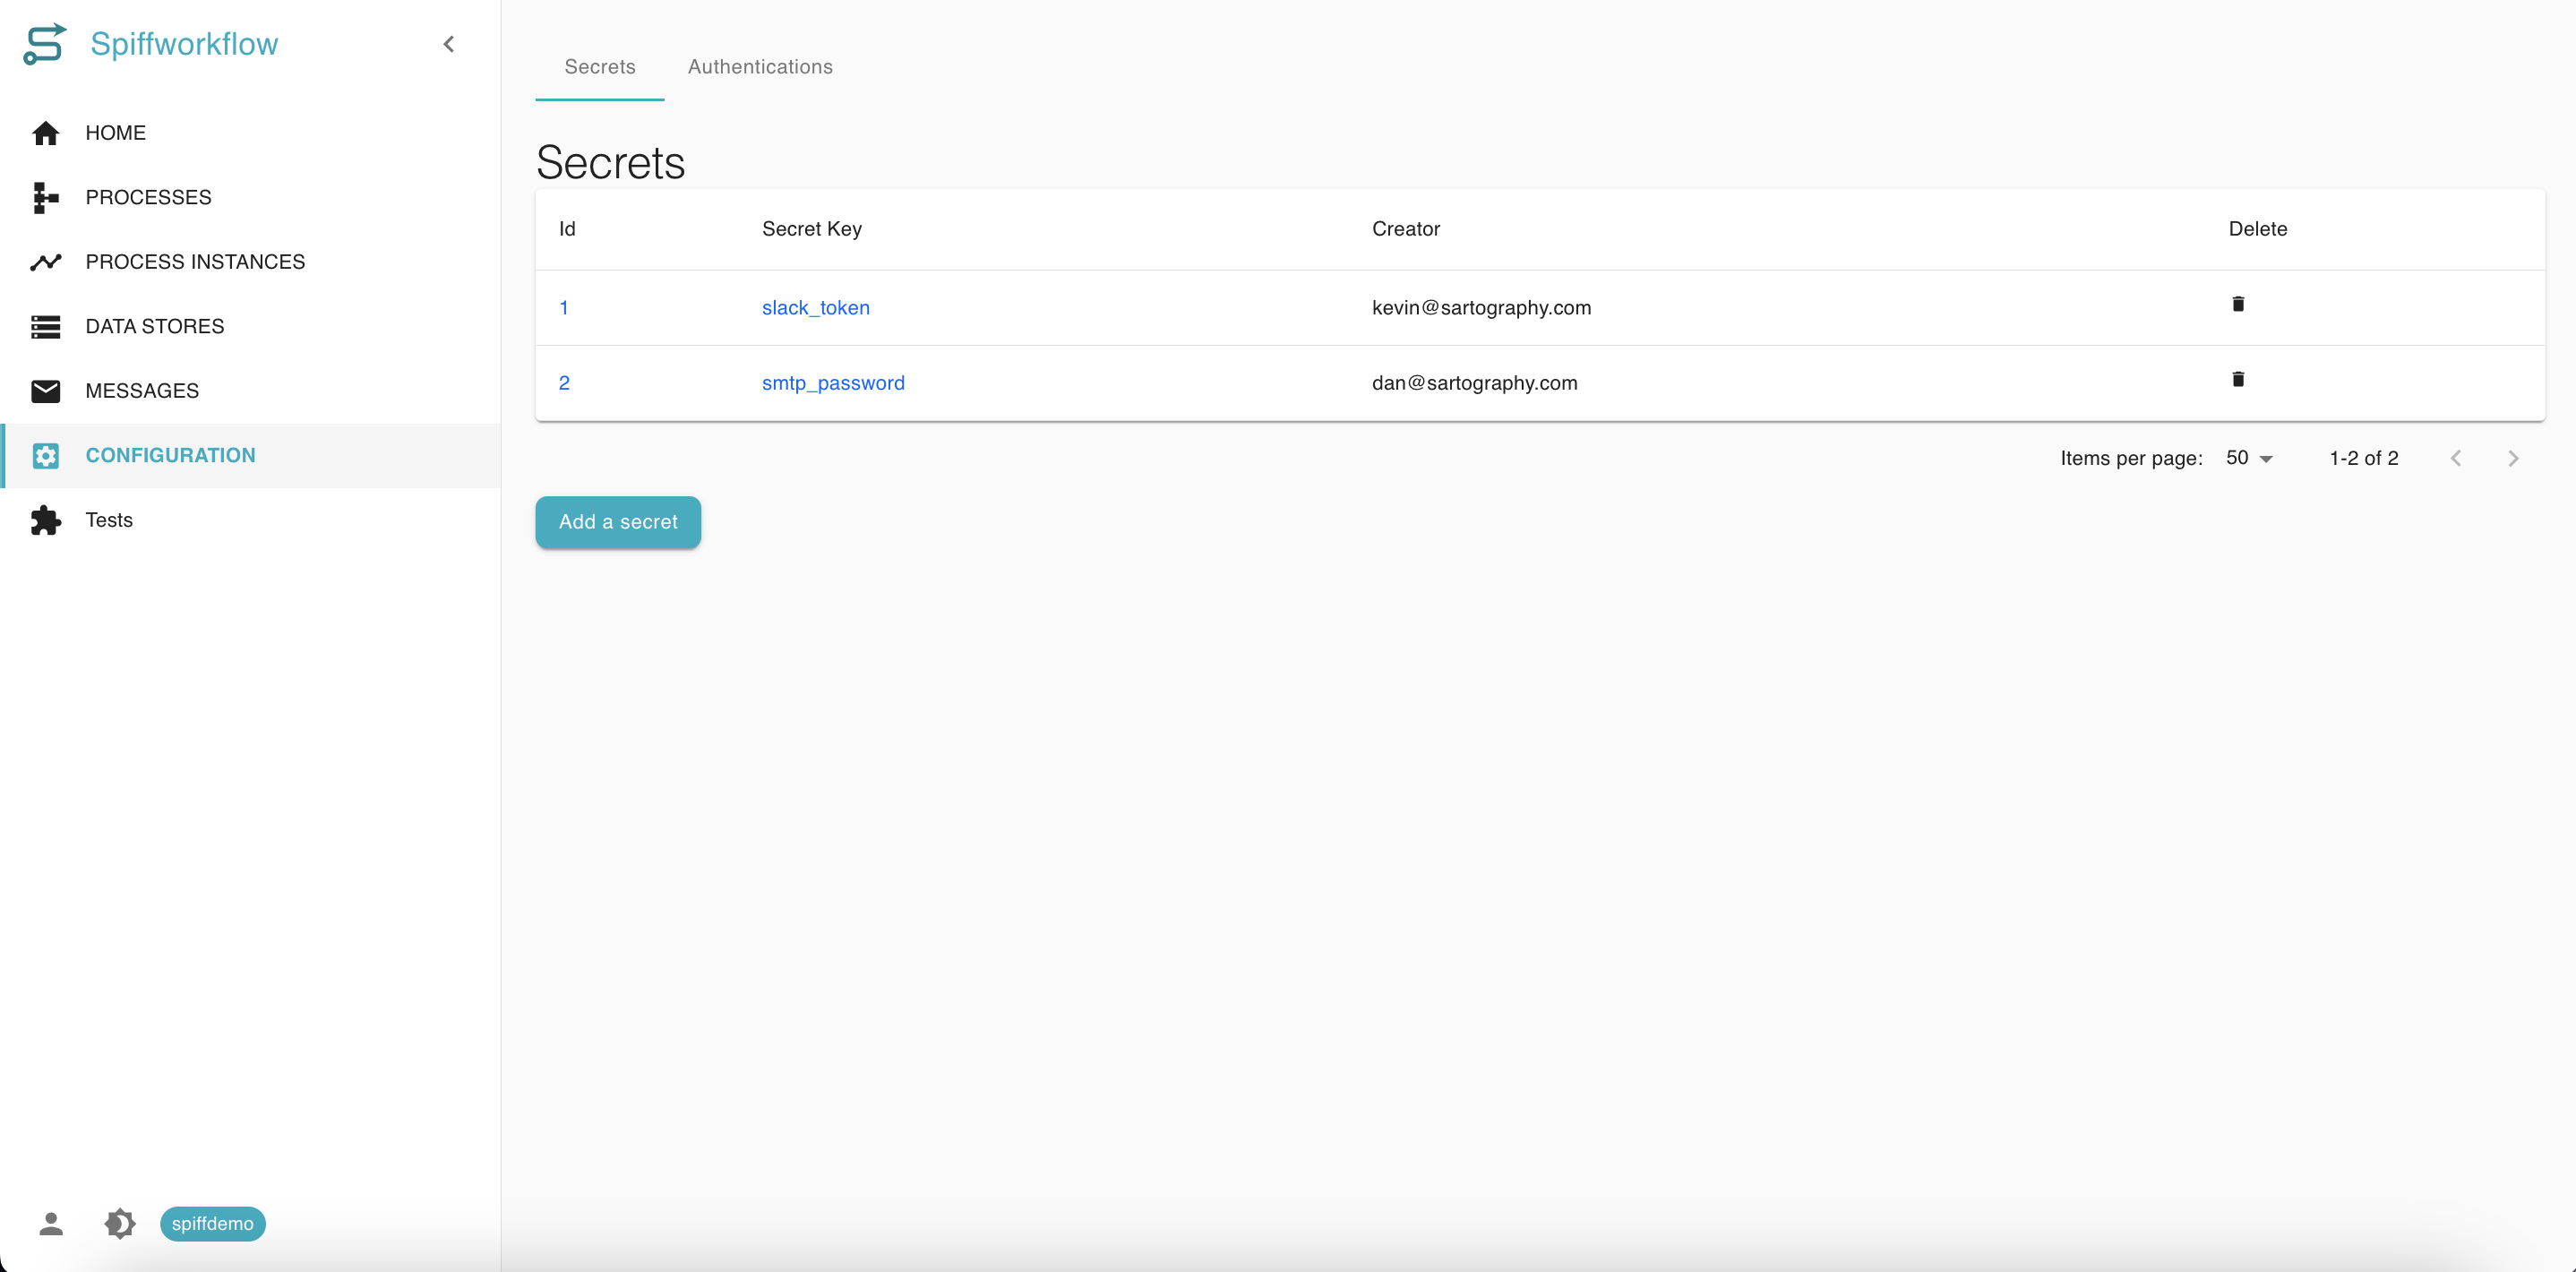
In the configuration, we have the following tabs:
Secrets: Allows the creation and management of secret key-value pairs such as API tokens, passwords, or other sensitive credentials. Each secret shows the name, creator, and a delete option.
Authentications: Lets users define and manage identity sources or authentication schemes for use within workflows. Includes a JSON editor for Local Configuration, enabling advanced control over environment variables and system behavior.
This section is typically used by developers or system administrators when setting up integration workflows or secure processes.
Tests
The Tests section allows users to generate BPMN unit tests from completed process instances.
This feature supports workflow testing, quality assurance, and integration with continuous delivery pipelines.
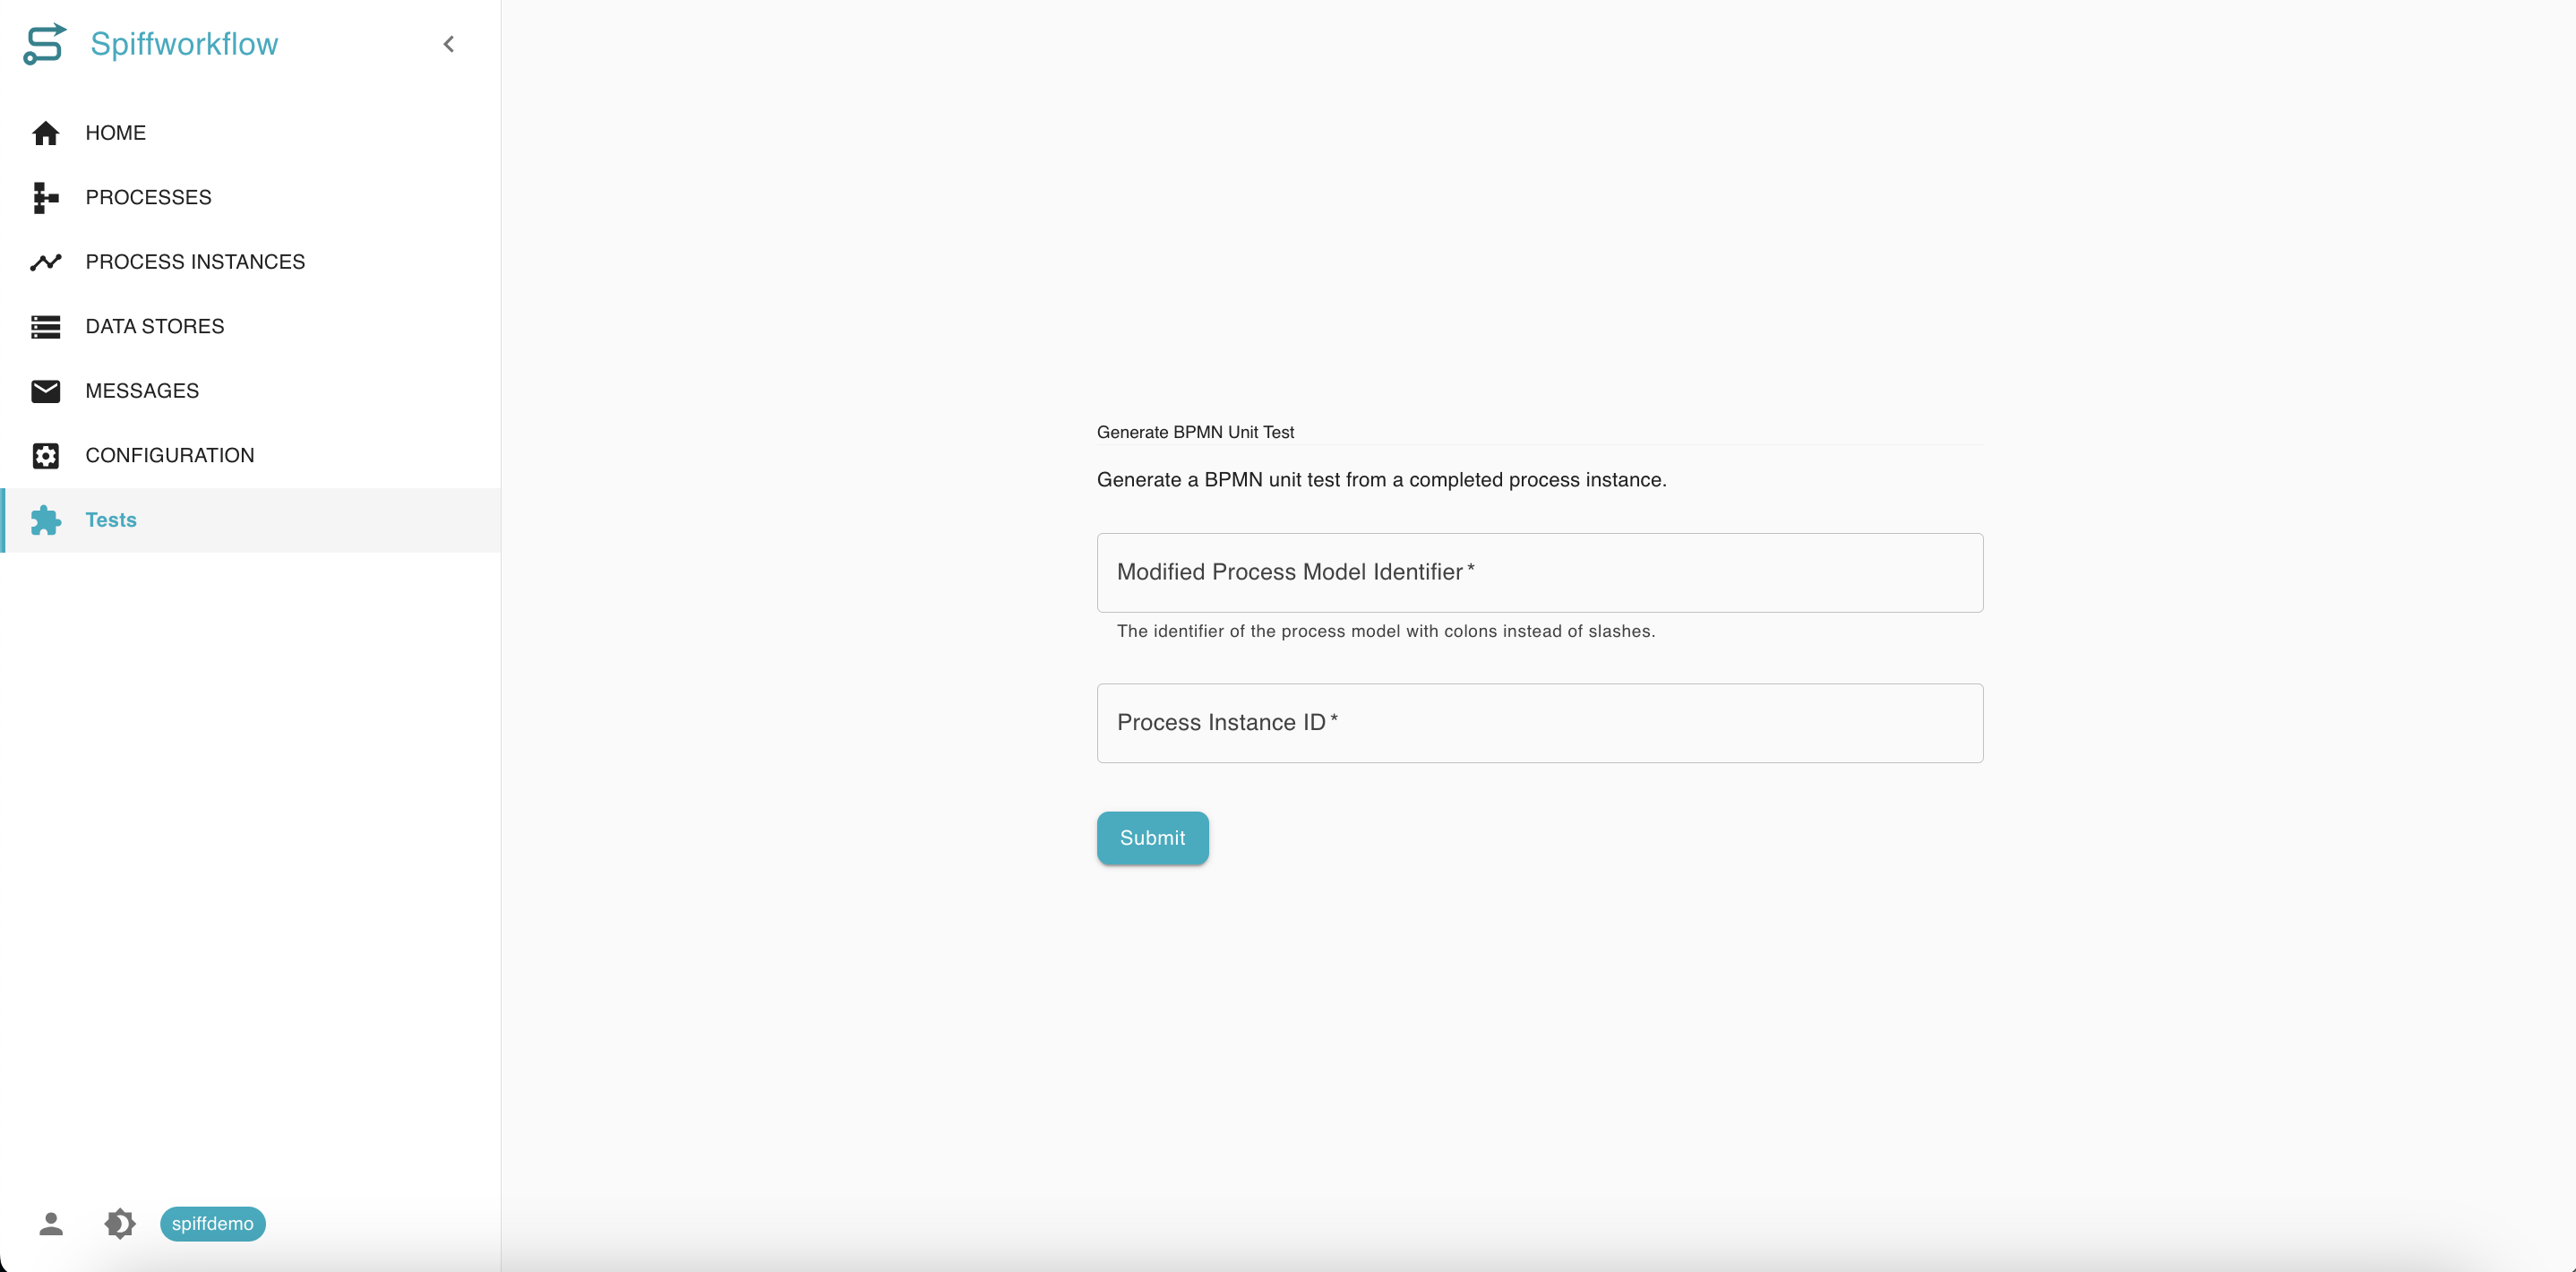
In the tests, we have the following fields:
Modified Process Model Identifier: A formatted identifier using colons instead of slashes (e.g.,
example:ticket).Process Instance ID: The unique identifier of a completed workflow instance.
By submitting these details, a BPMN unit test is automatically generated, which can be stored and reused to validate future changes to the same workflow.
How to Create a BPMN Process
With SpiffWorkflow, you can easily initiate a new process instance.
In SpiffWorkflow, users do not create processes globally—instead, they work inside their personal playground, a sandboxed environment where they can define and test their own workflows securely.
Step 1: Access Your Playground Account
Before creating any processes, users must first request access to a Playground account. This is a personal, isolated space where they can freely create and test workflows. You will complete the Request playground Process to request access to a private playground that you control.
Once approved and logged in:
Navigate to Processes from the left-hand menu.
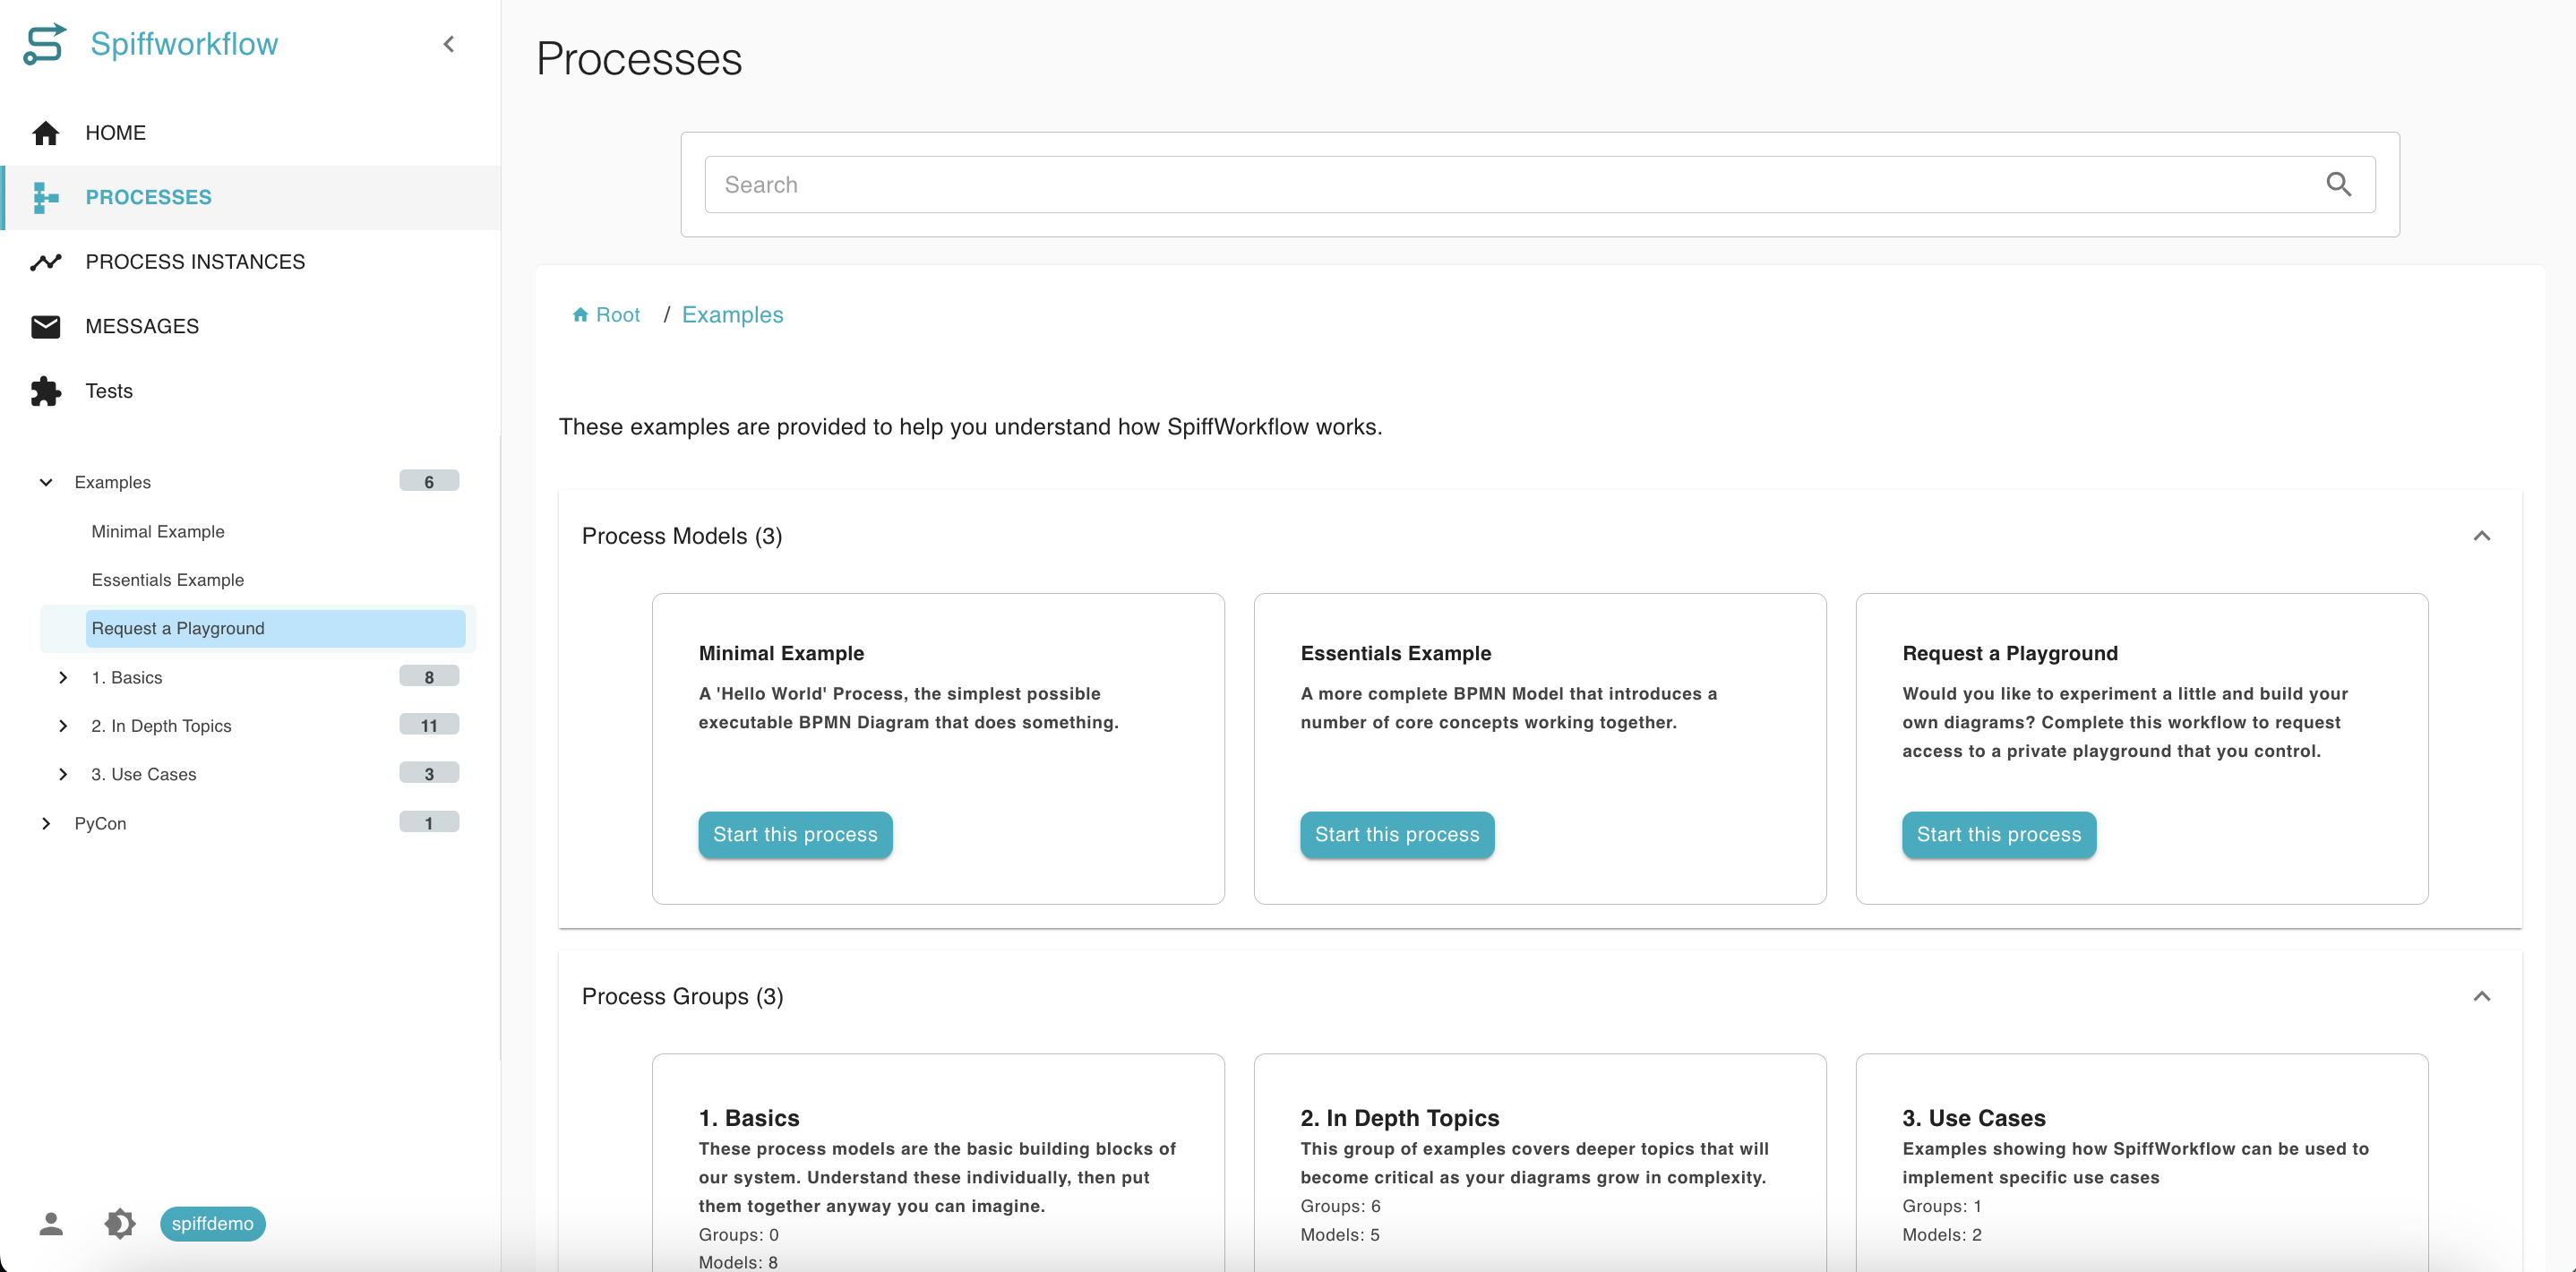
You’ll now see three sections:
Process Models – Individual workflows created in your account.
Process Groups – Logical folders to organize process models.
Data Stores – Shared or user-specific data repositories (optional).
Step 2: Create a New Process Model
You can create a process directly inside your playground’s Process Models section or within a Process Group.
To create a process model:
In your personal playground, locate either:
The Process Models section (for top-level processes), or
A specific Process Group you’ve created (click into it first).
Click the + icon to open the Add Process Model form.
Fill in the required details:
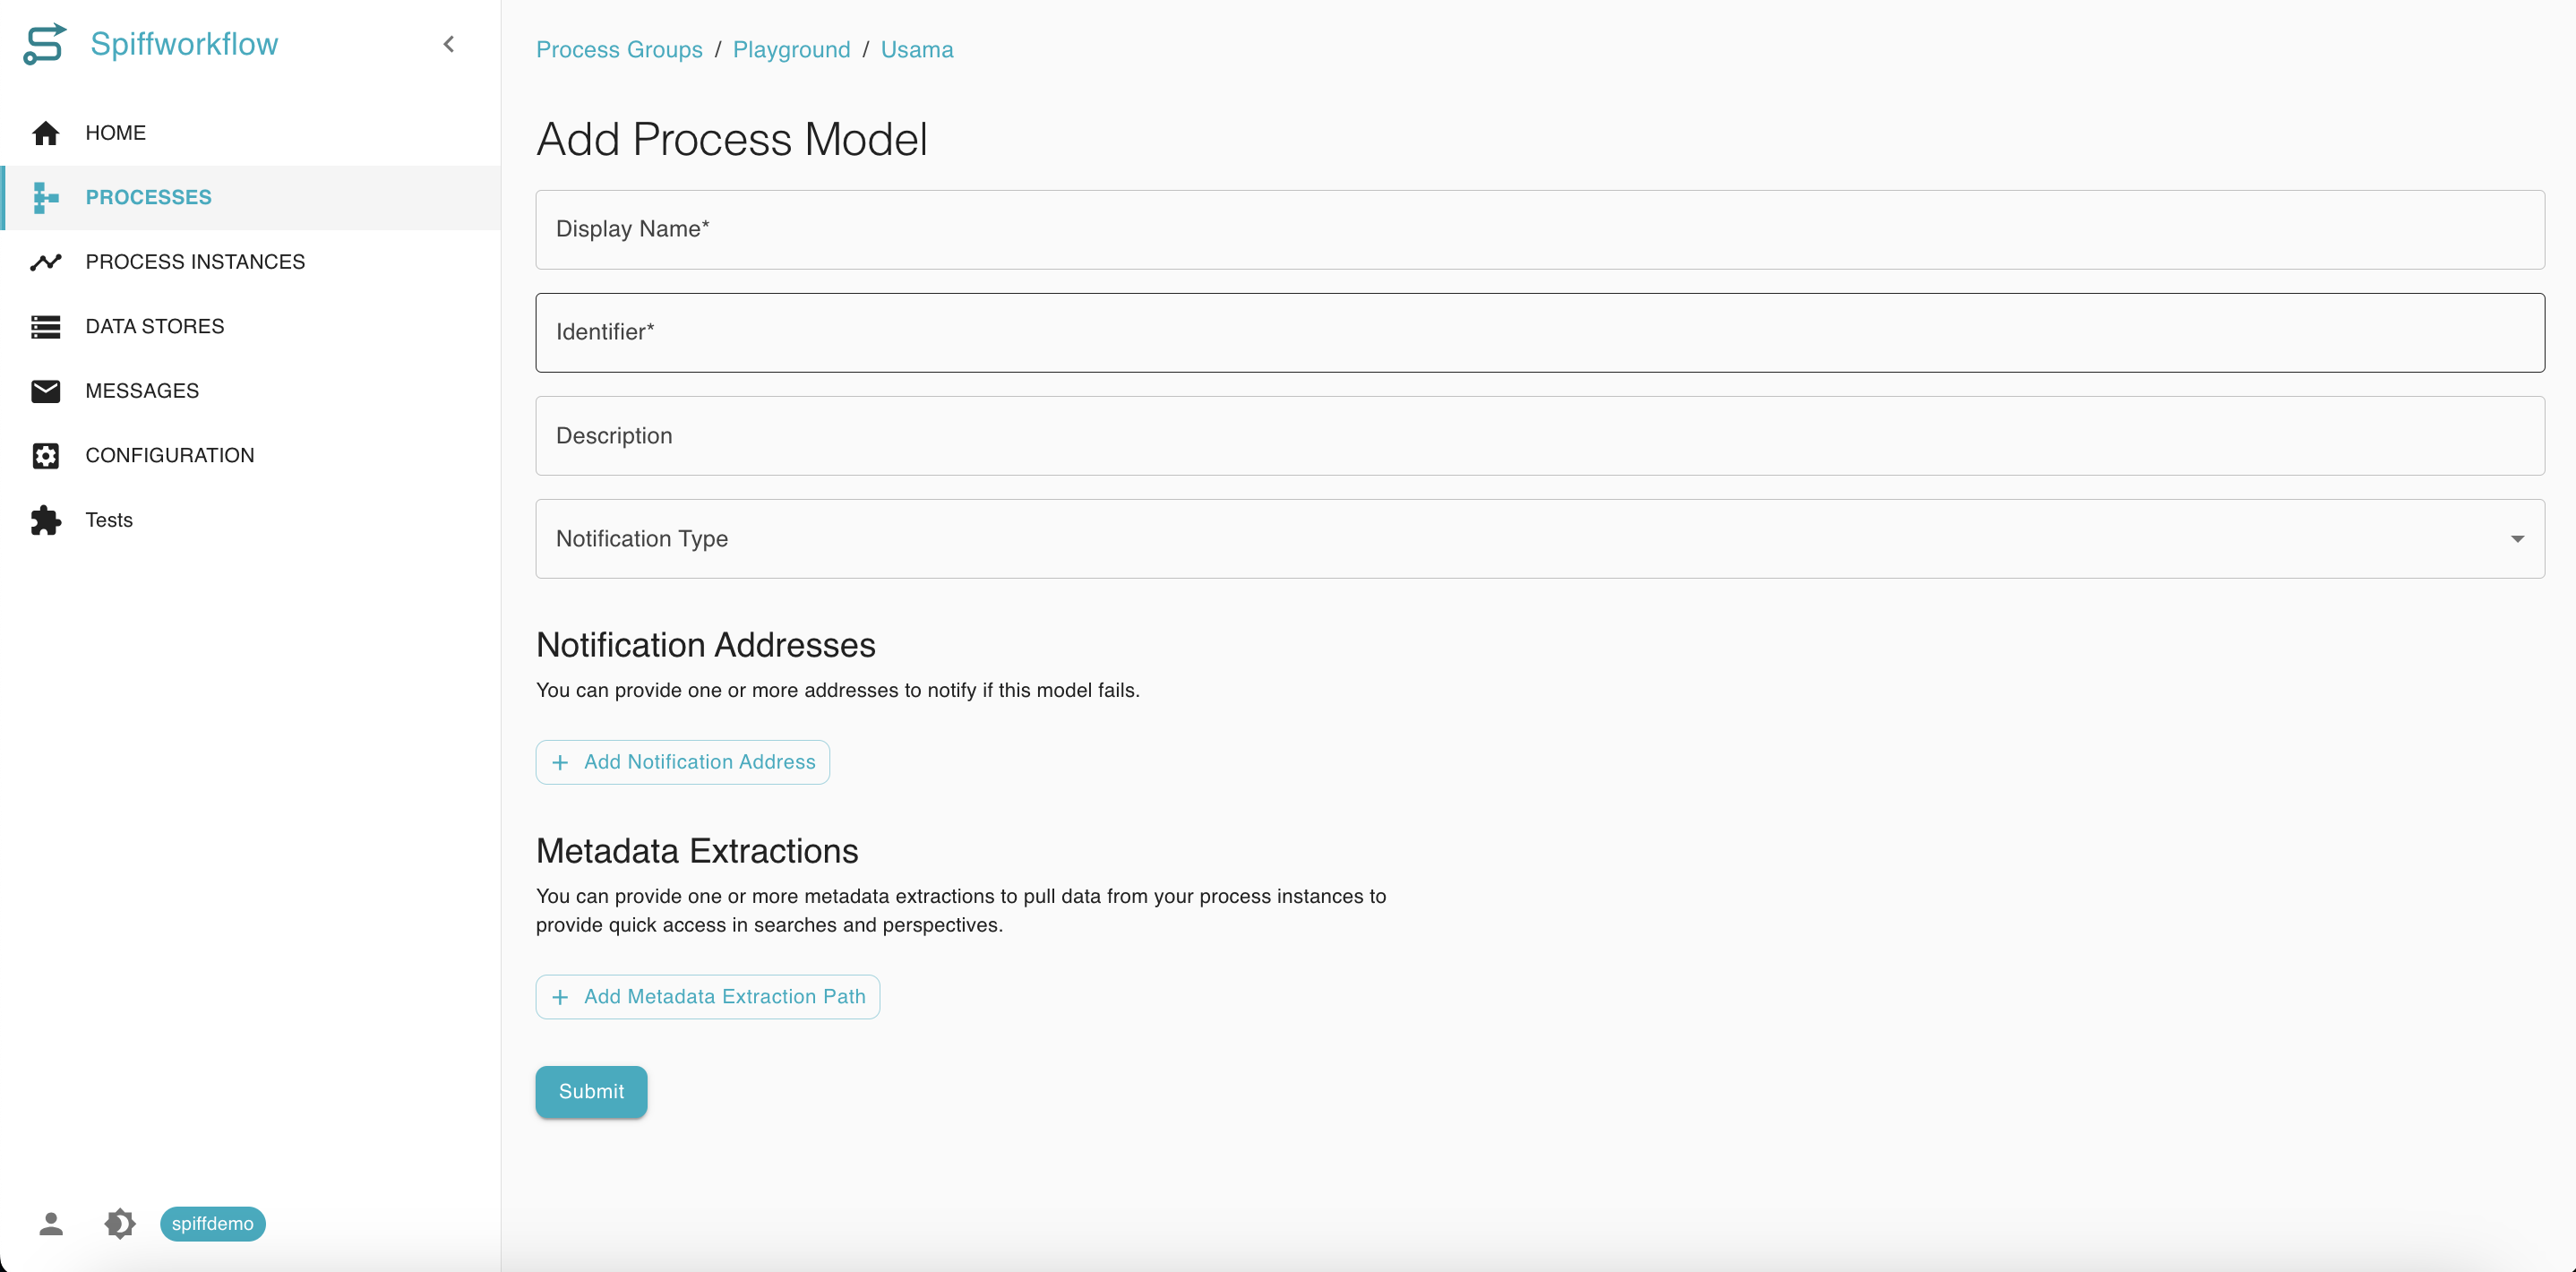
Display Name: Title displayed in the UI.
Identifier: Unique name used for referencing the model programmatically.
Description: Optional details to describe the process purpose.
Notification Type: (Optional) Select how you’d like to be notified of failures.
Optional Configuration:
Notification Addresses: Add one or more email addresses for error alerts.
Metadata Extractions: Define metadata fields for reporting, filtering, or search.
Click Submit to finalize the creation.
Step 3: Create a New Process Group (Optional)
If you want to use process groups, you can first create a process group and within that process group you can create a process model. To create the process group:
In your playground view, go to the Process Groups section.
Click the + icon next to the section header.
Fill out the form:
Display Name: Human-readable title of the group.
Identifier: Unique machine-readable name (no spaces or special characters).
Description: Optional explanation of the group’s purpose.
Click Submit to create the new group.
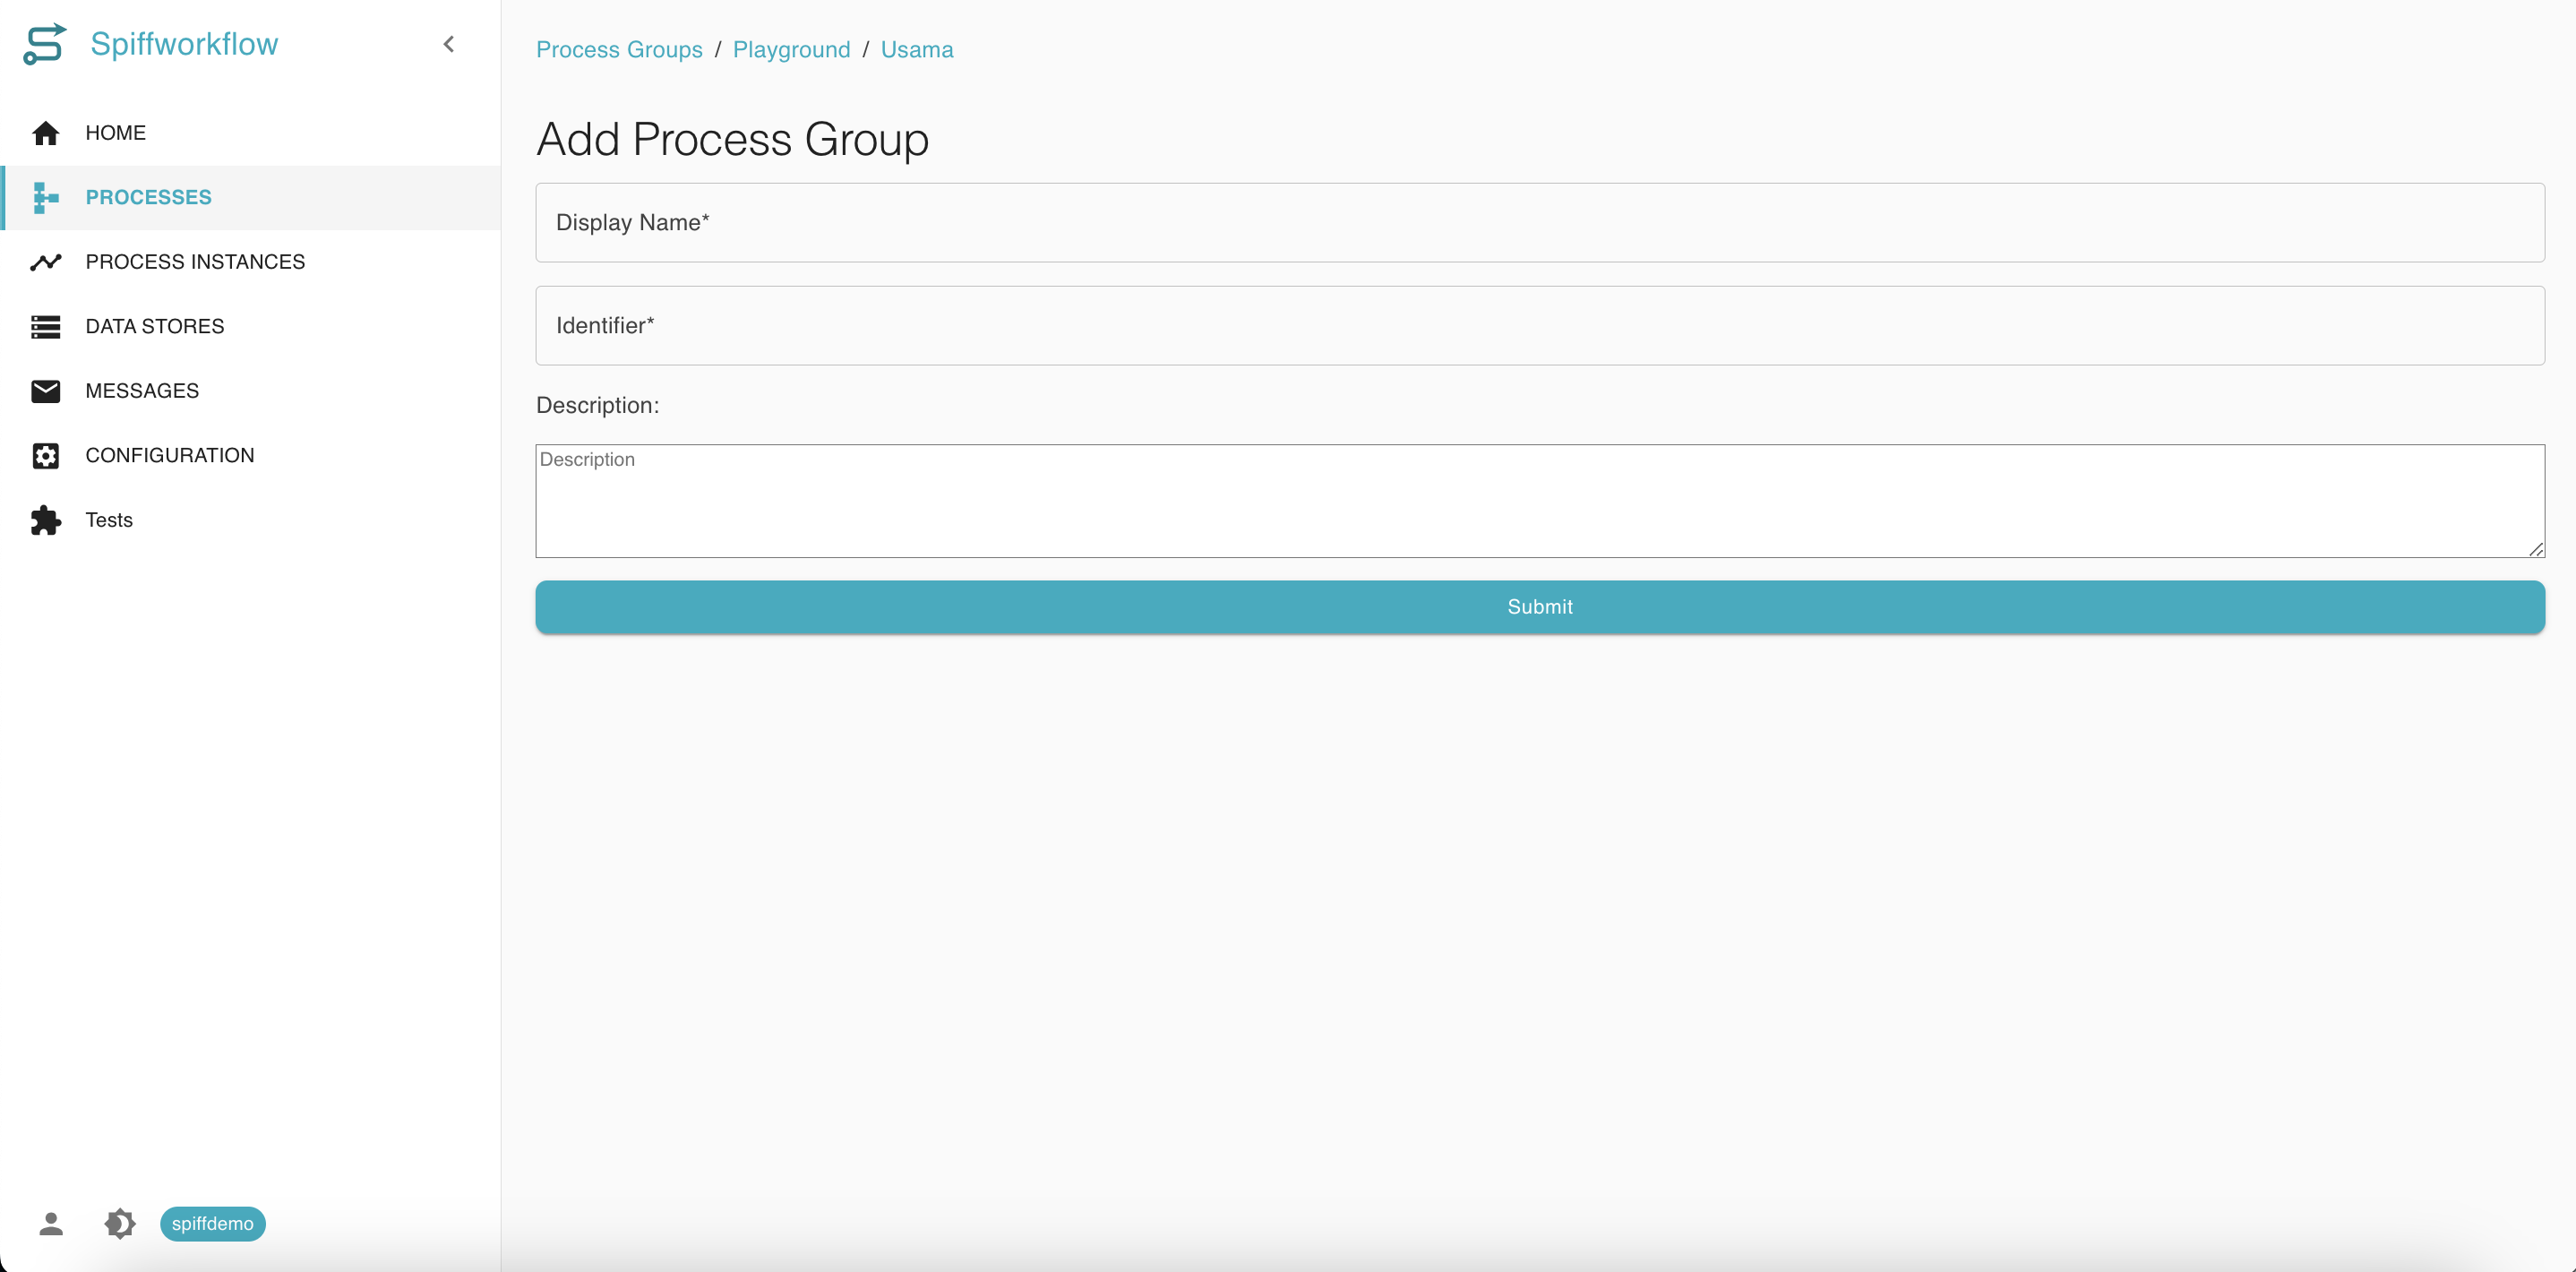
The group will now be listed under Process Groups in your playground. Now perform the step 2 to create a new process model.
Step 4: View and Manage the Process Model
After submission, the new process model will be created and listed in your Process Models section (or inside the selected process group).
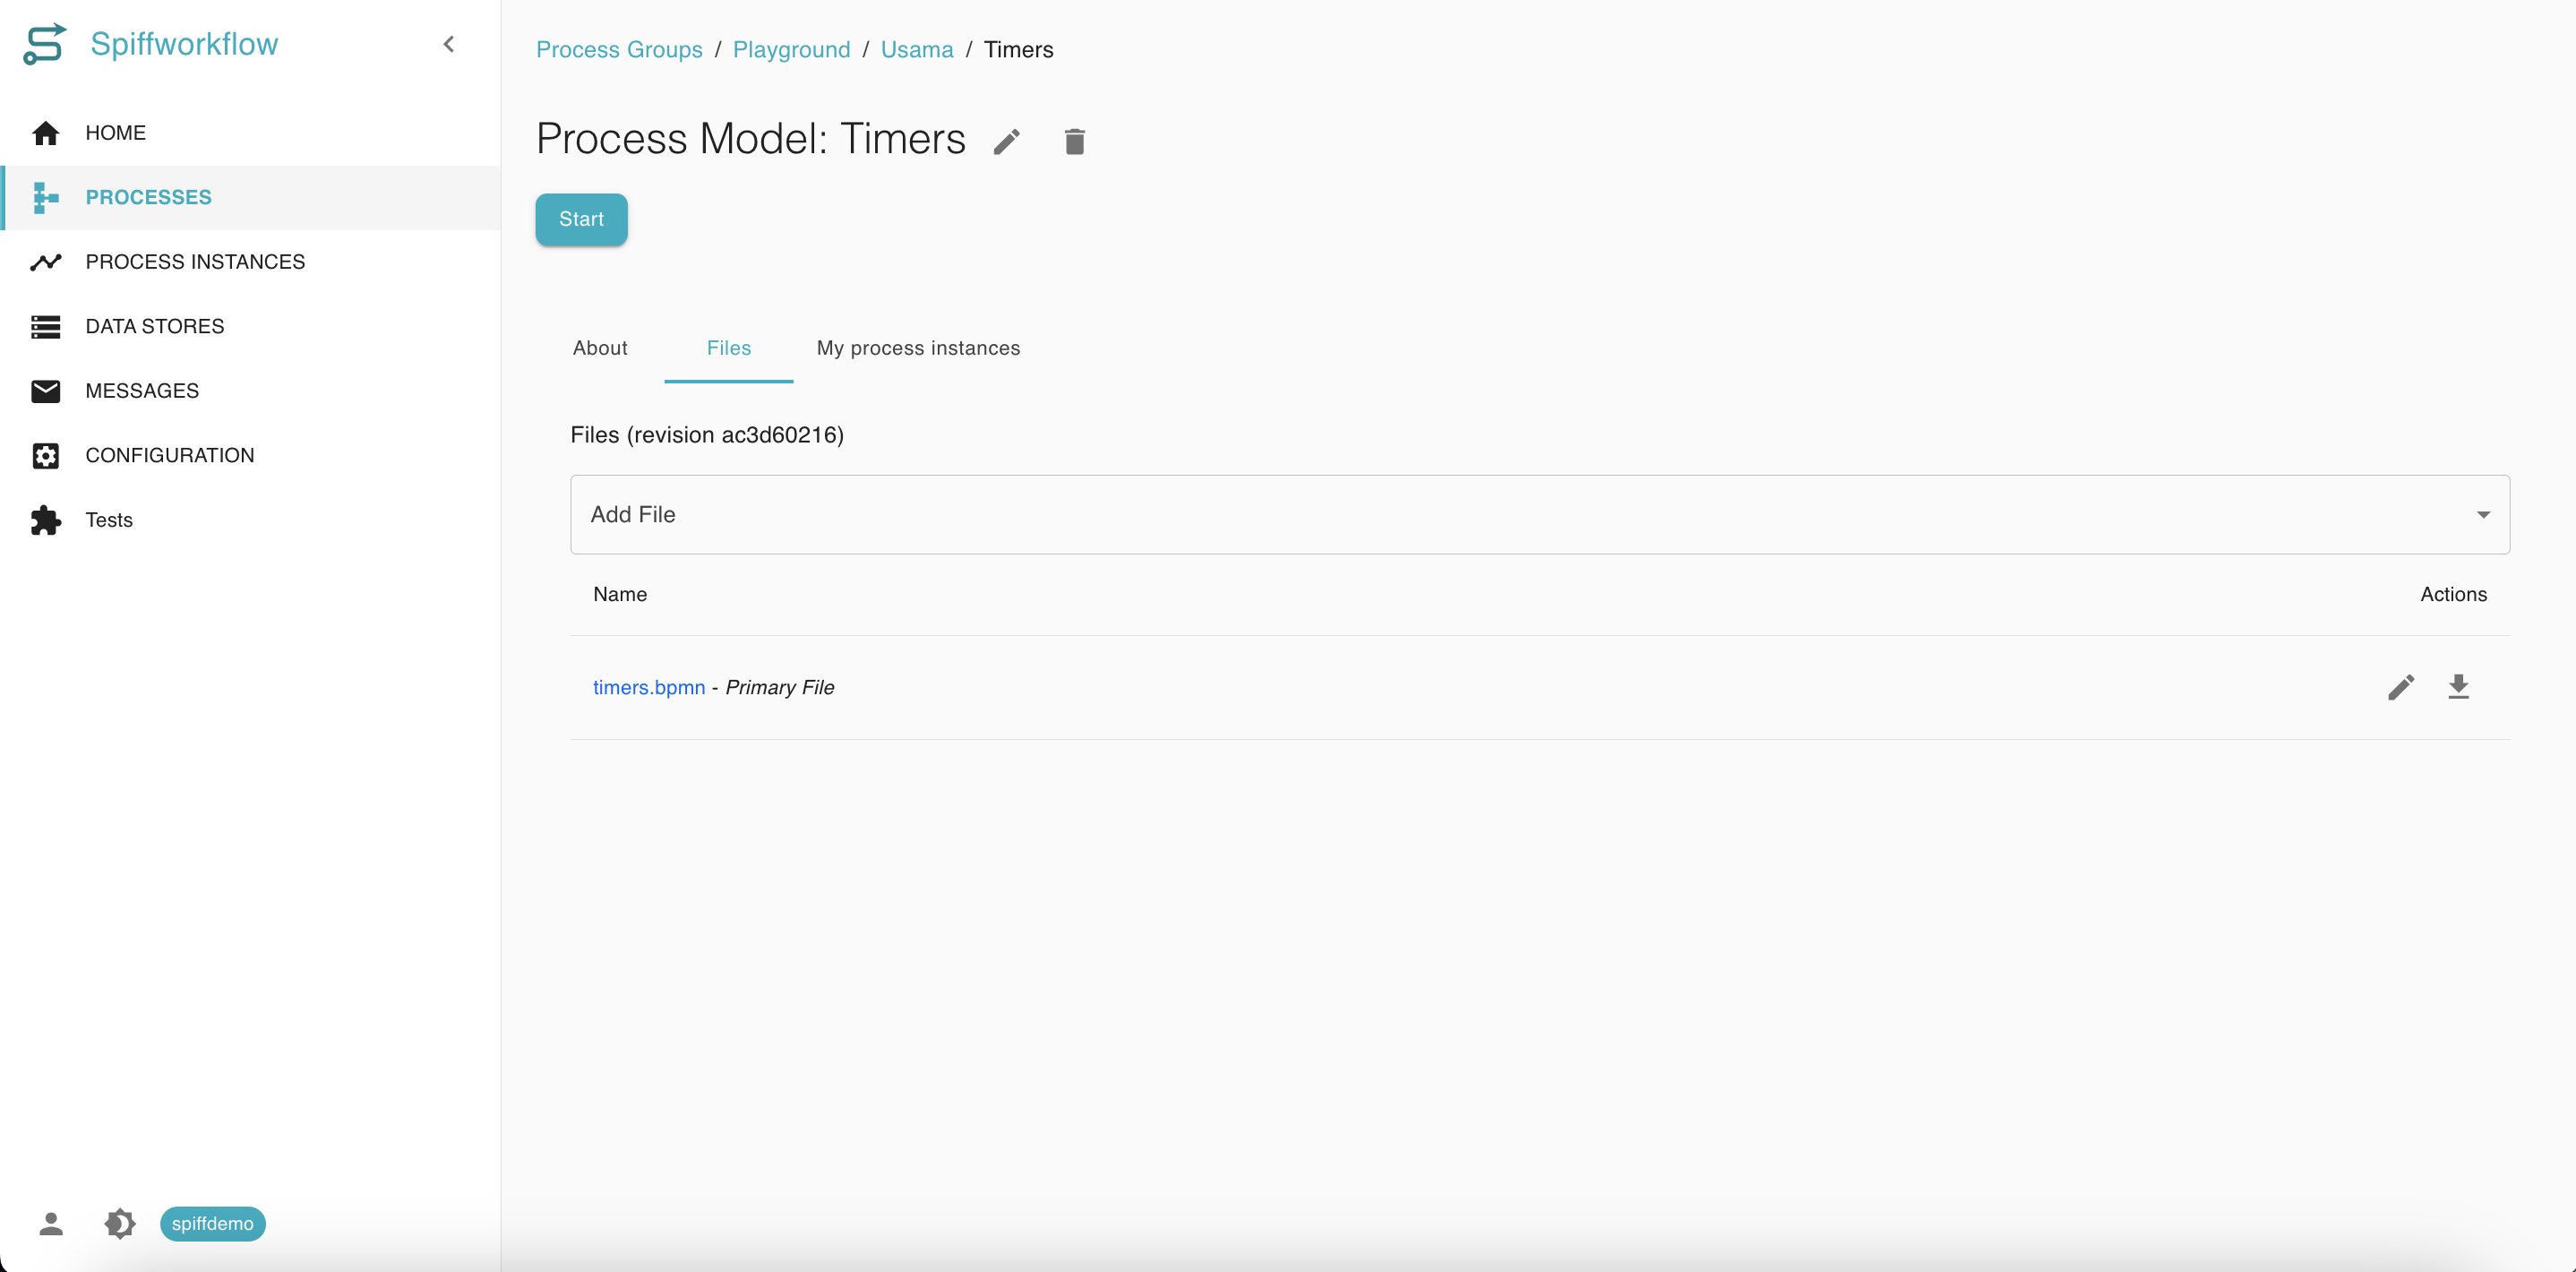
Click on the process model name to open its detail page.
You will see tabs for:
About: Basic information.
Files: Where BPMN files are stored.
My process instances: History of workflows started using this model.
Step 5: Open the BPMN File and Build Your Workflow
When a new process model is created, a default BPMN file (e.g., timers.bpmn) is also created.
To open the BPMN editor:
Click on the filename in the Files tab.
This opens the drag-and-drop BPMN editor.
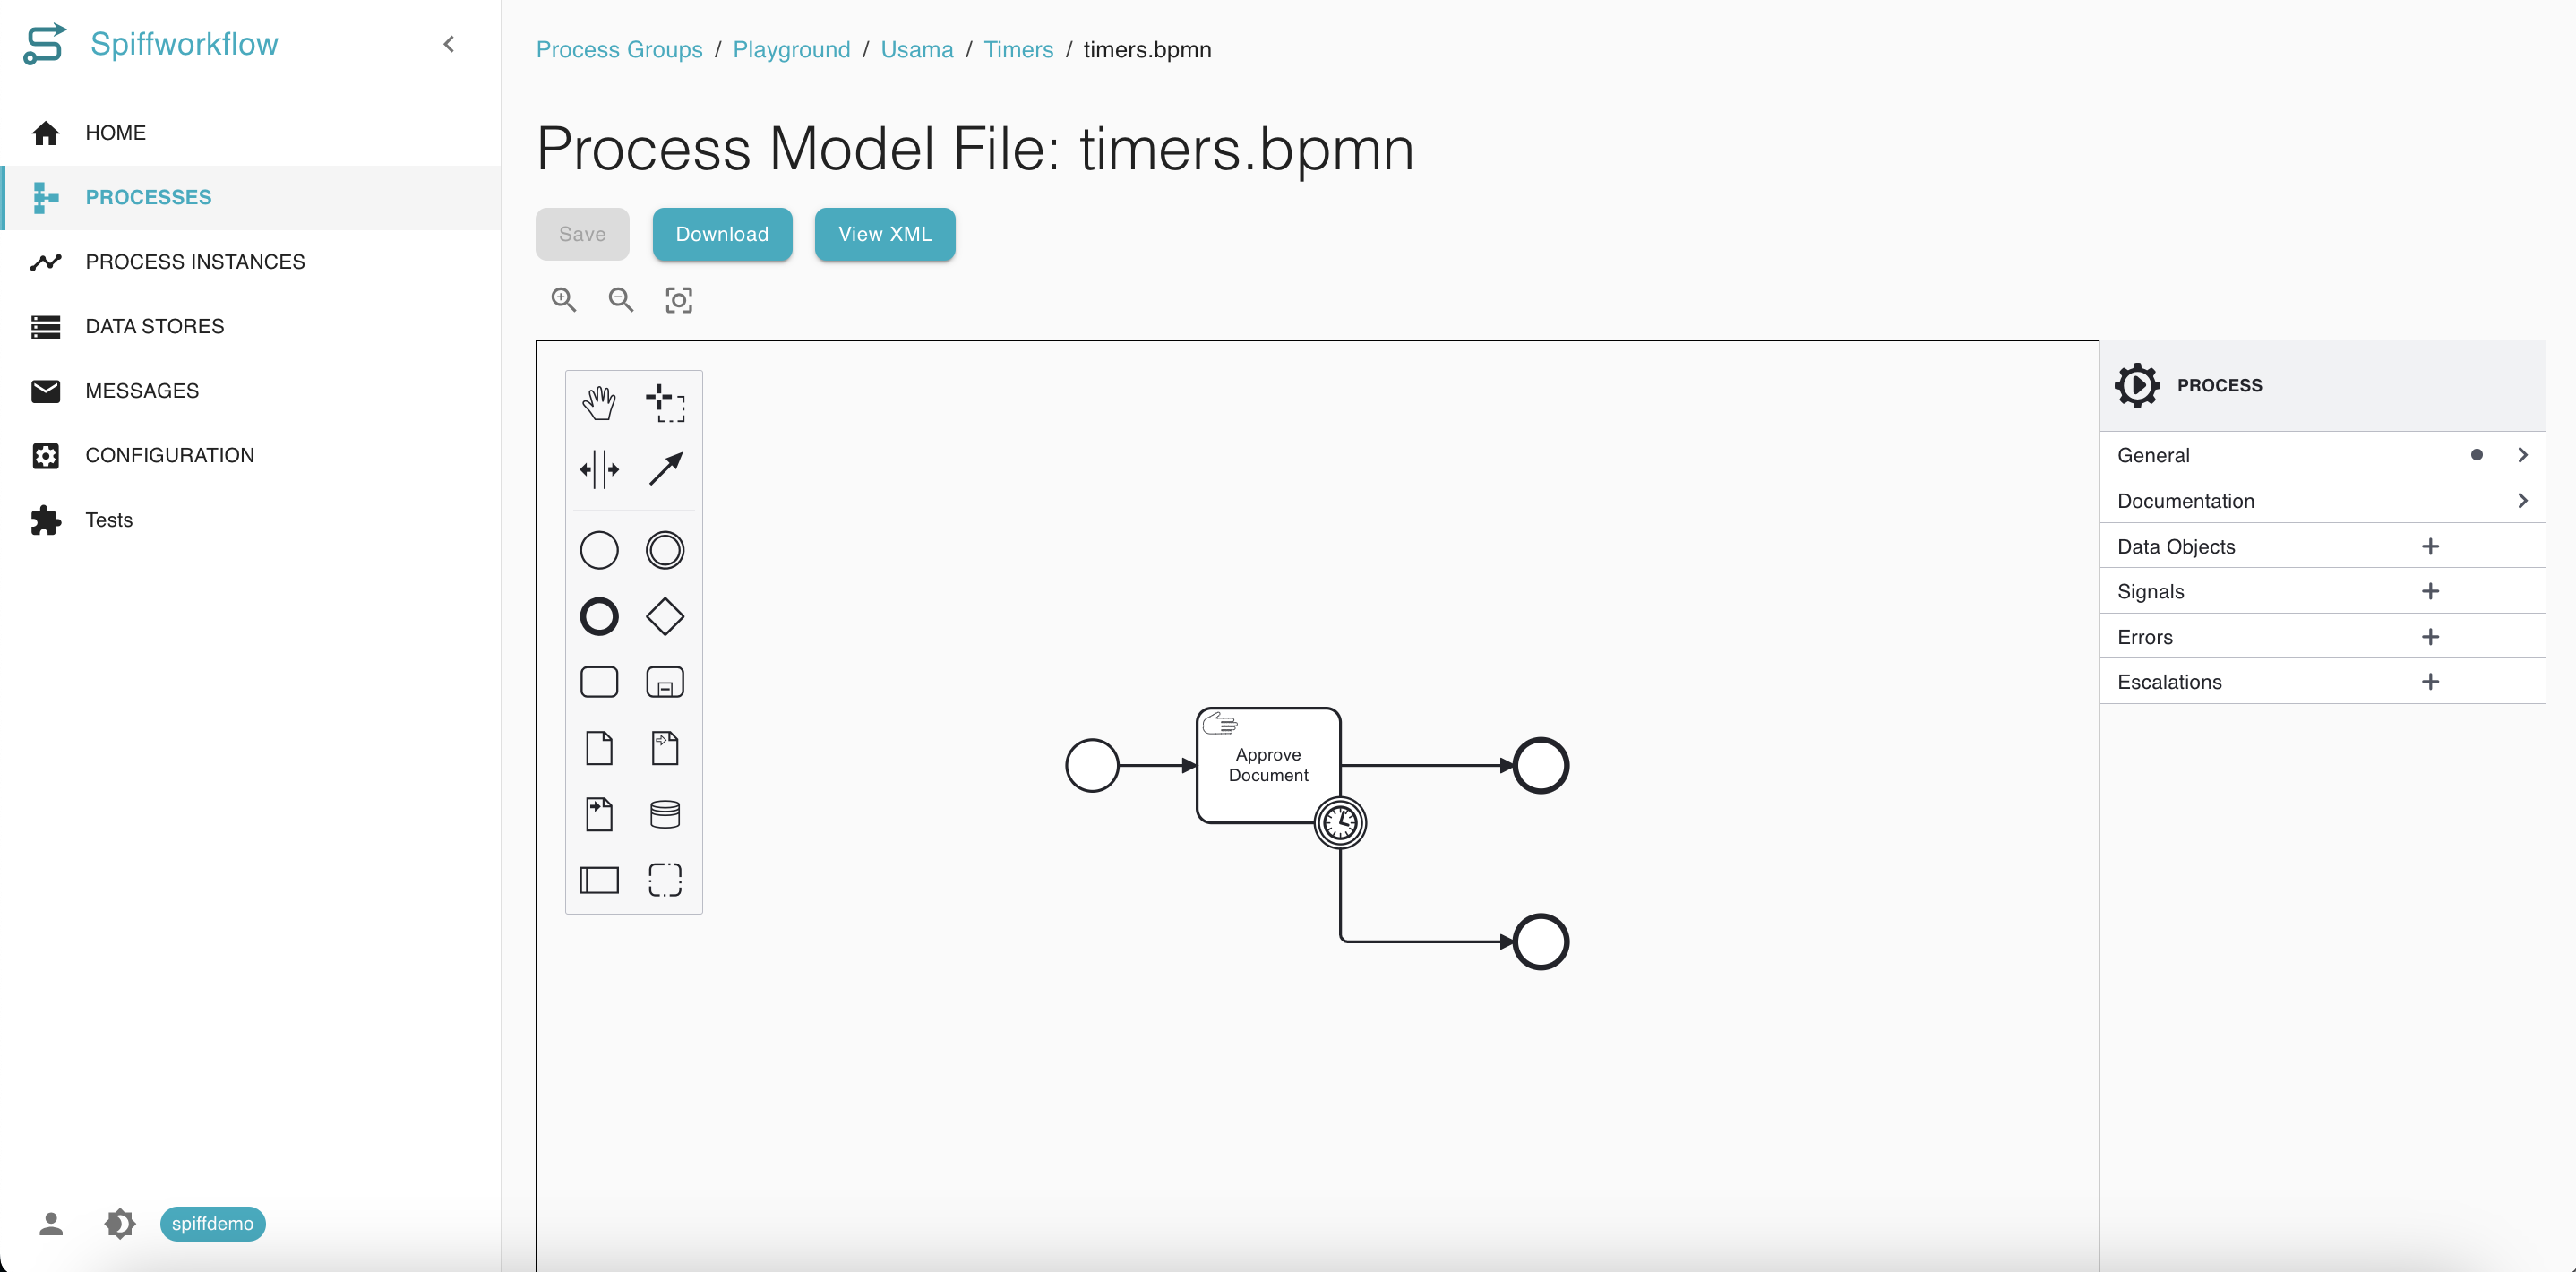
In the editor:
Use the tools on the left to create start events, tasks, gateways, end events, etc.
Use the right-hand property panel to configure individual elements (names, data fields, conditions).
Save your changes or download the XML if needed.
You are now ready to build your full process logic visually using BPMN notation.
How to view process steps for the process you just started
Once you have started a process in SpiffWorkflow, you can track its progress and view the exact point where it currently is. This helps you understand which tasks have been completed and which ones are pending or require user input.
Step 1: Navigate to the Process Instances Section
From the left-hand menu, click on Process Instances.
This page shows a list of all workflows you’ve started or are involved in, including key details like:
Instance ID
Process Name
Start and End Time
Started By
Milestone
Status
Action
Step 2: Open the Process Instance
To view a specific process instance:
Find your process in the list (you can filter or search if needed).
In the Action column, click the link icon. This will open a detailed view of the process instance.
Step 3: View the Process Diagram and Current Step
Once inside the process instance:
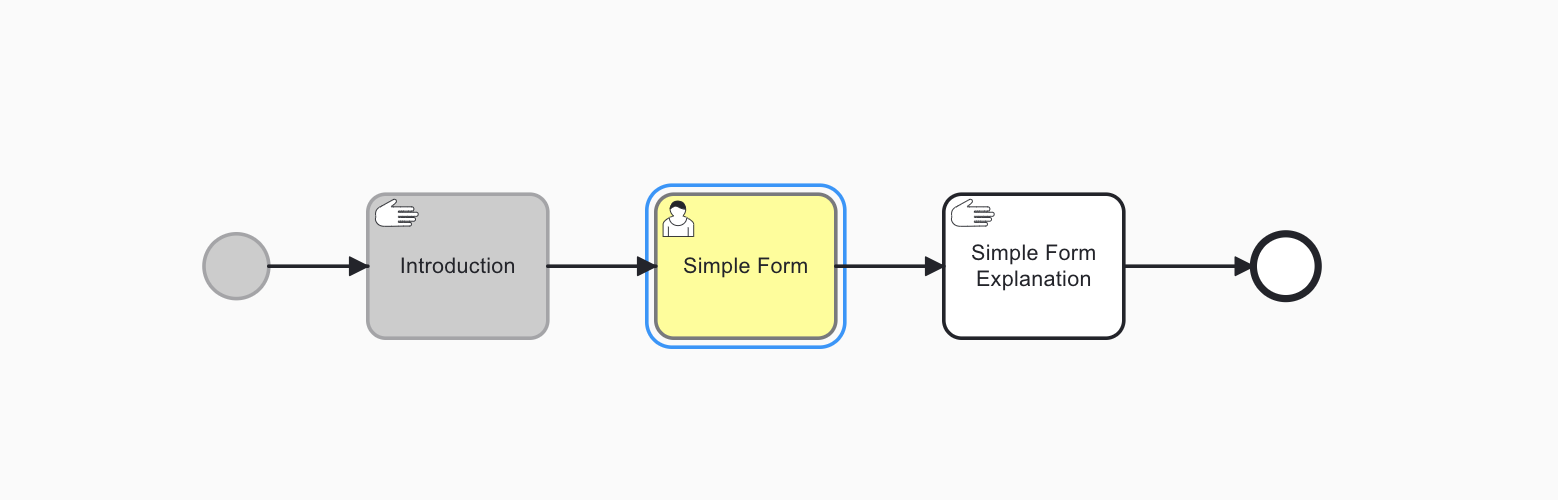
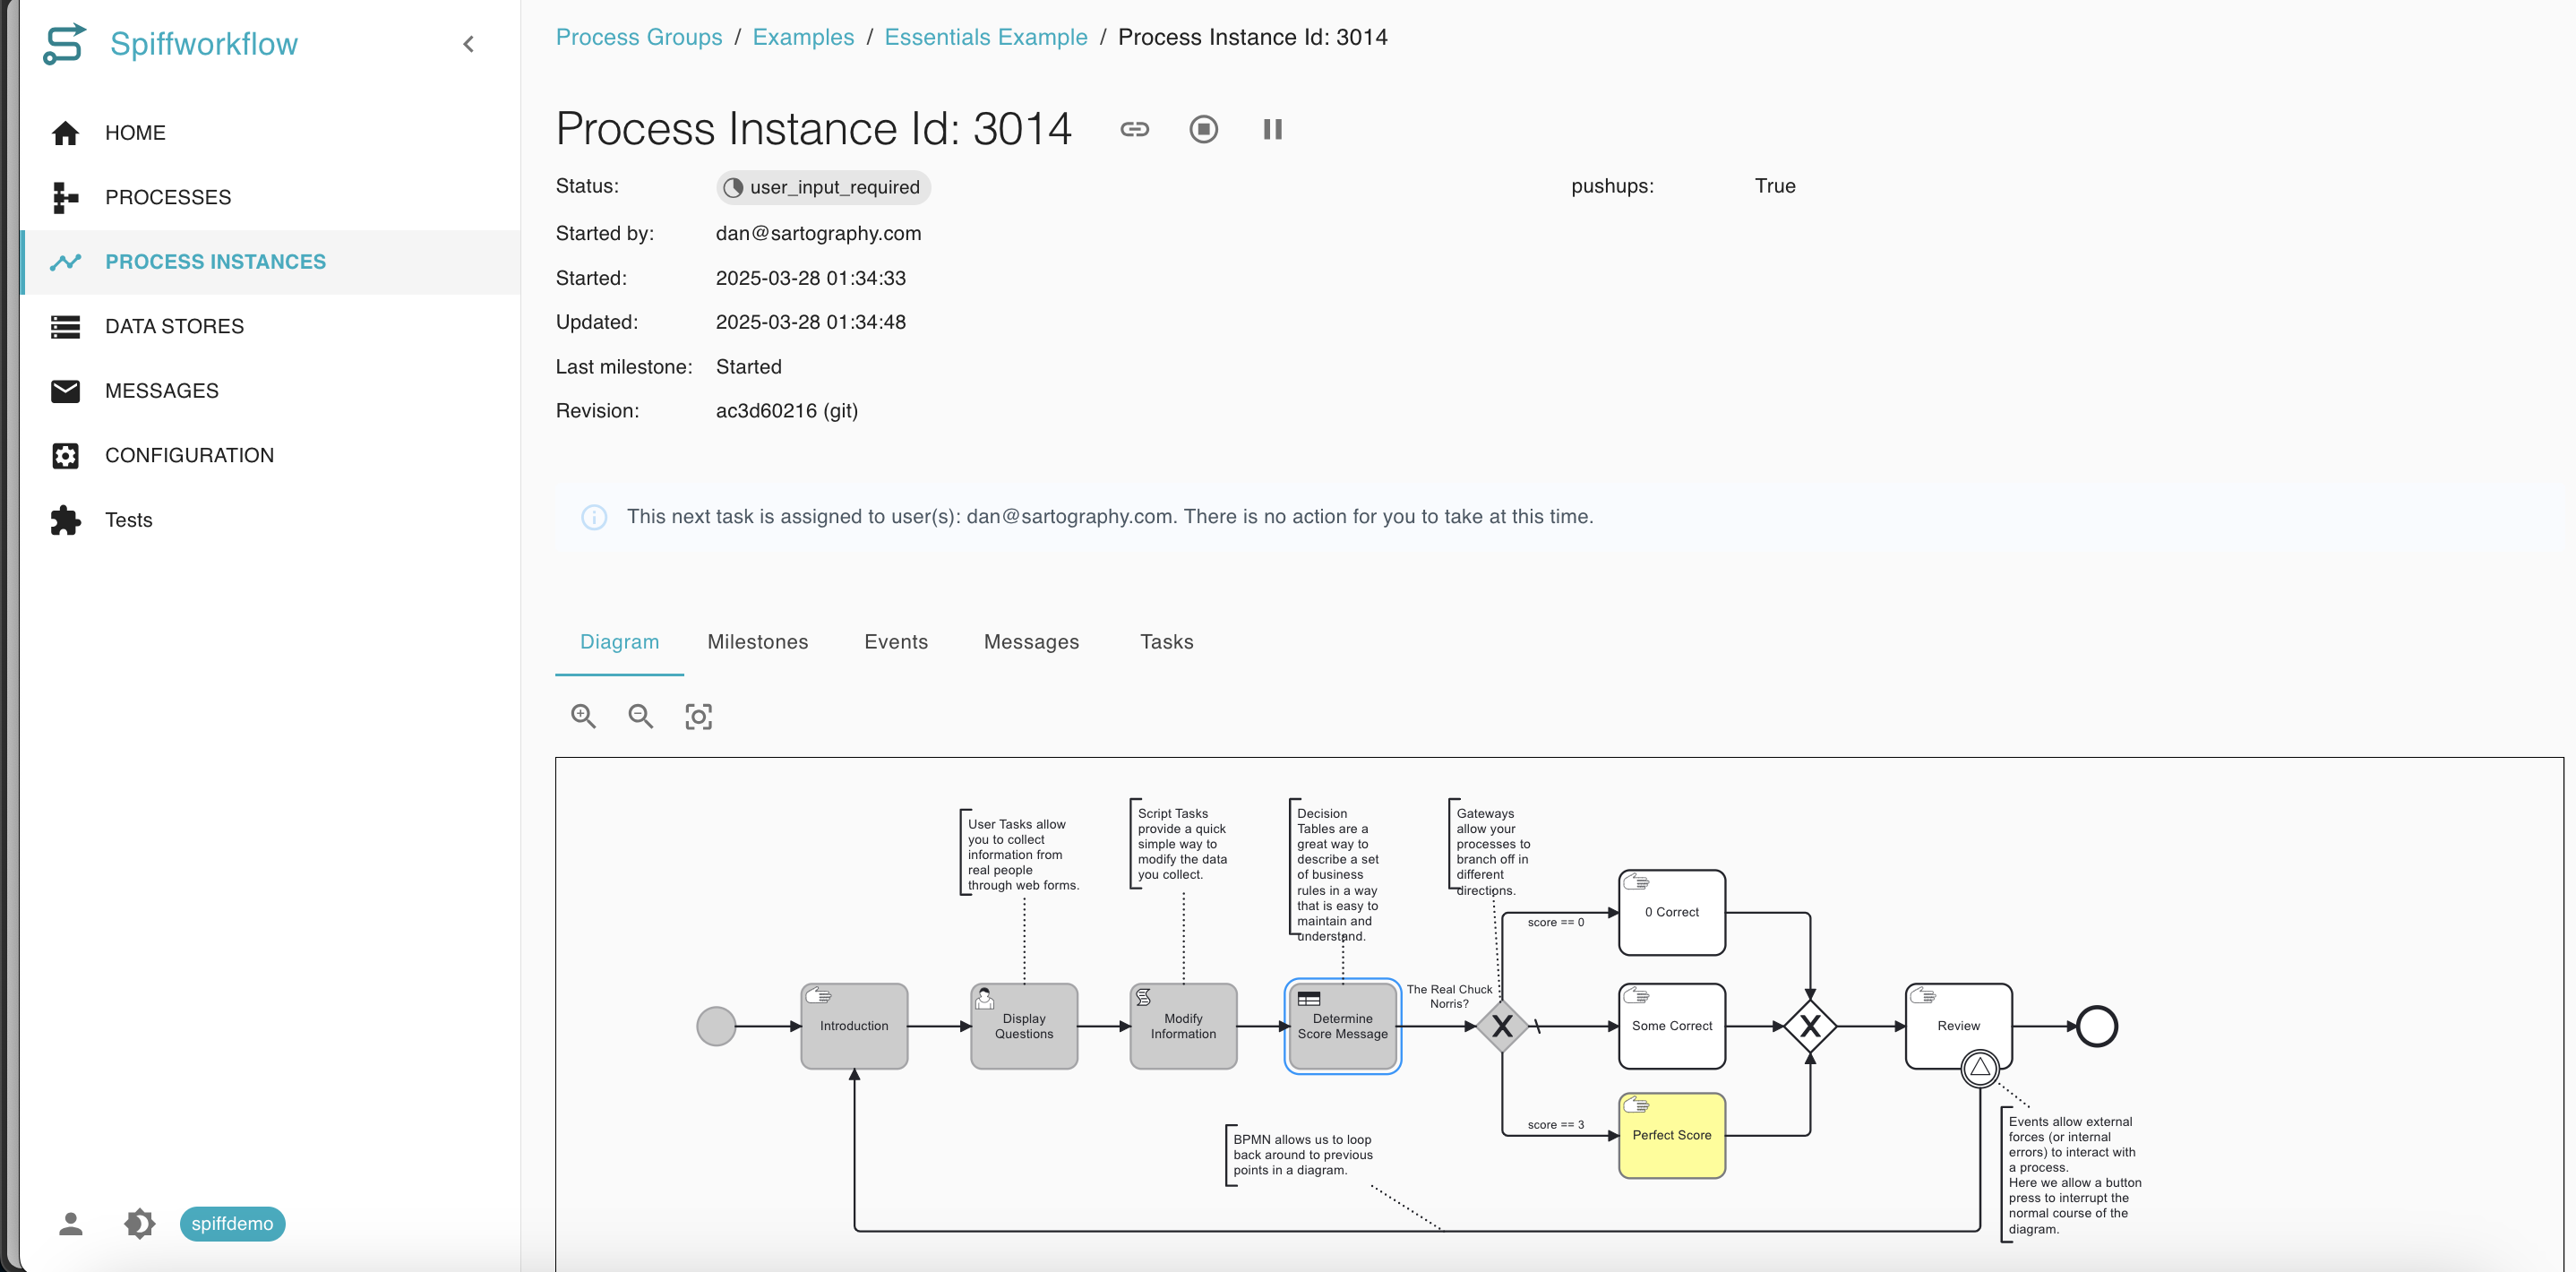
You will see the BPMN diagram representing the full workflow.
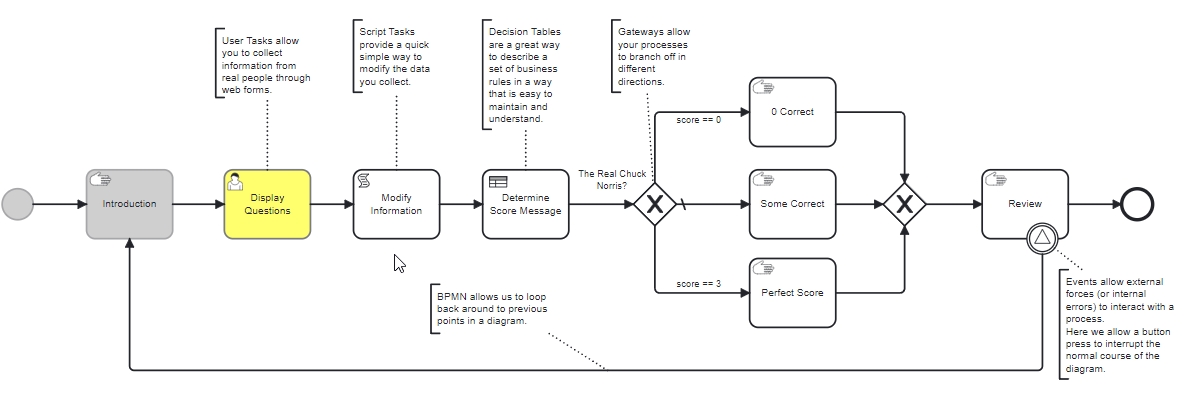
The current task is visually highlighted in yellow.
The steps already taken by the workflow are shaded in grey.
The unvisited or future steps remain in default black/white.
This color-coded visual helps you instantly understand:
Which tasks are complete.
Which task is currently active or waiting for user input.
What the future path of the process looks like.
How to view the Process-defined metadata for a process instance
The Process-defined metadata can provide valuable insights into its history, current status, and other important details that are specifically created and used within a particular process.
With the SpiffWorkflow platform, users can easily view the metadata for a process instance.
To check the metadata of a process instance, follow these steps.
Step 1: Navigate to the “Home” or “Process Instance” section as before
Once you’re signed in, navigate to the Process Instance section.
Open the process instance you want to view the metadata for.
Step 2: View metadata for the selected process instance
Click on the process instance you want to view. Upon clicking this, you will be able to view the information about the given instance.
You’ll find the metadata on the right.
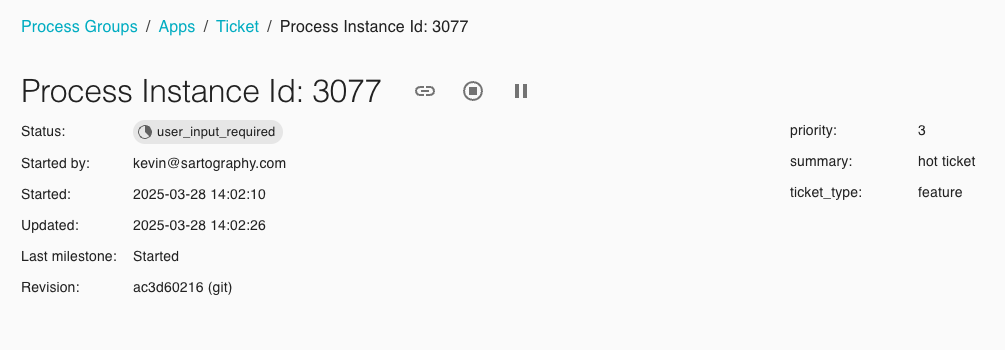
By following these simple steps, you can easily view the metadata for a process instance in SpiffWorkflow.
How to view Process Model files
The process model files provide great transparency into our internal business rules and processes. You can dig deep into the decision-making process and really understand how the process and organization operate. With these steps, you’ll be able to access process models easily and efficiently.
Step 1: Head over to the process section
Once you have successfully signed in, navigate to the process section. This section allows you to access all the process groups and process models you have access to.
You can either search for a process model using the search bar or navigate through displayed processes to find the process model.
Step 2: Access the process model files
Once you have clicked on the process you want to view, a list of the model files that are associated with the process will appear.
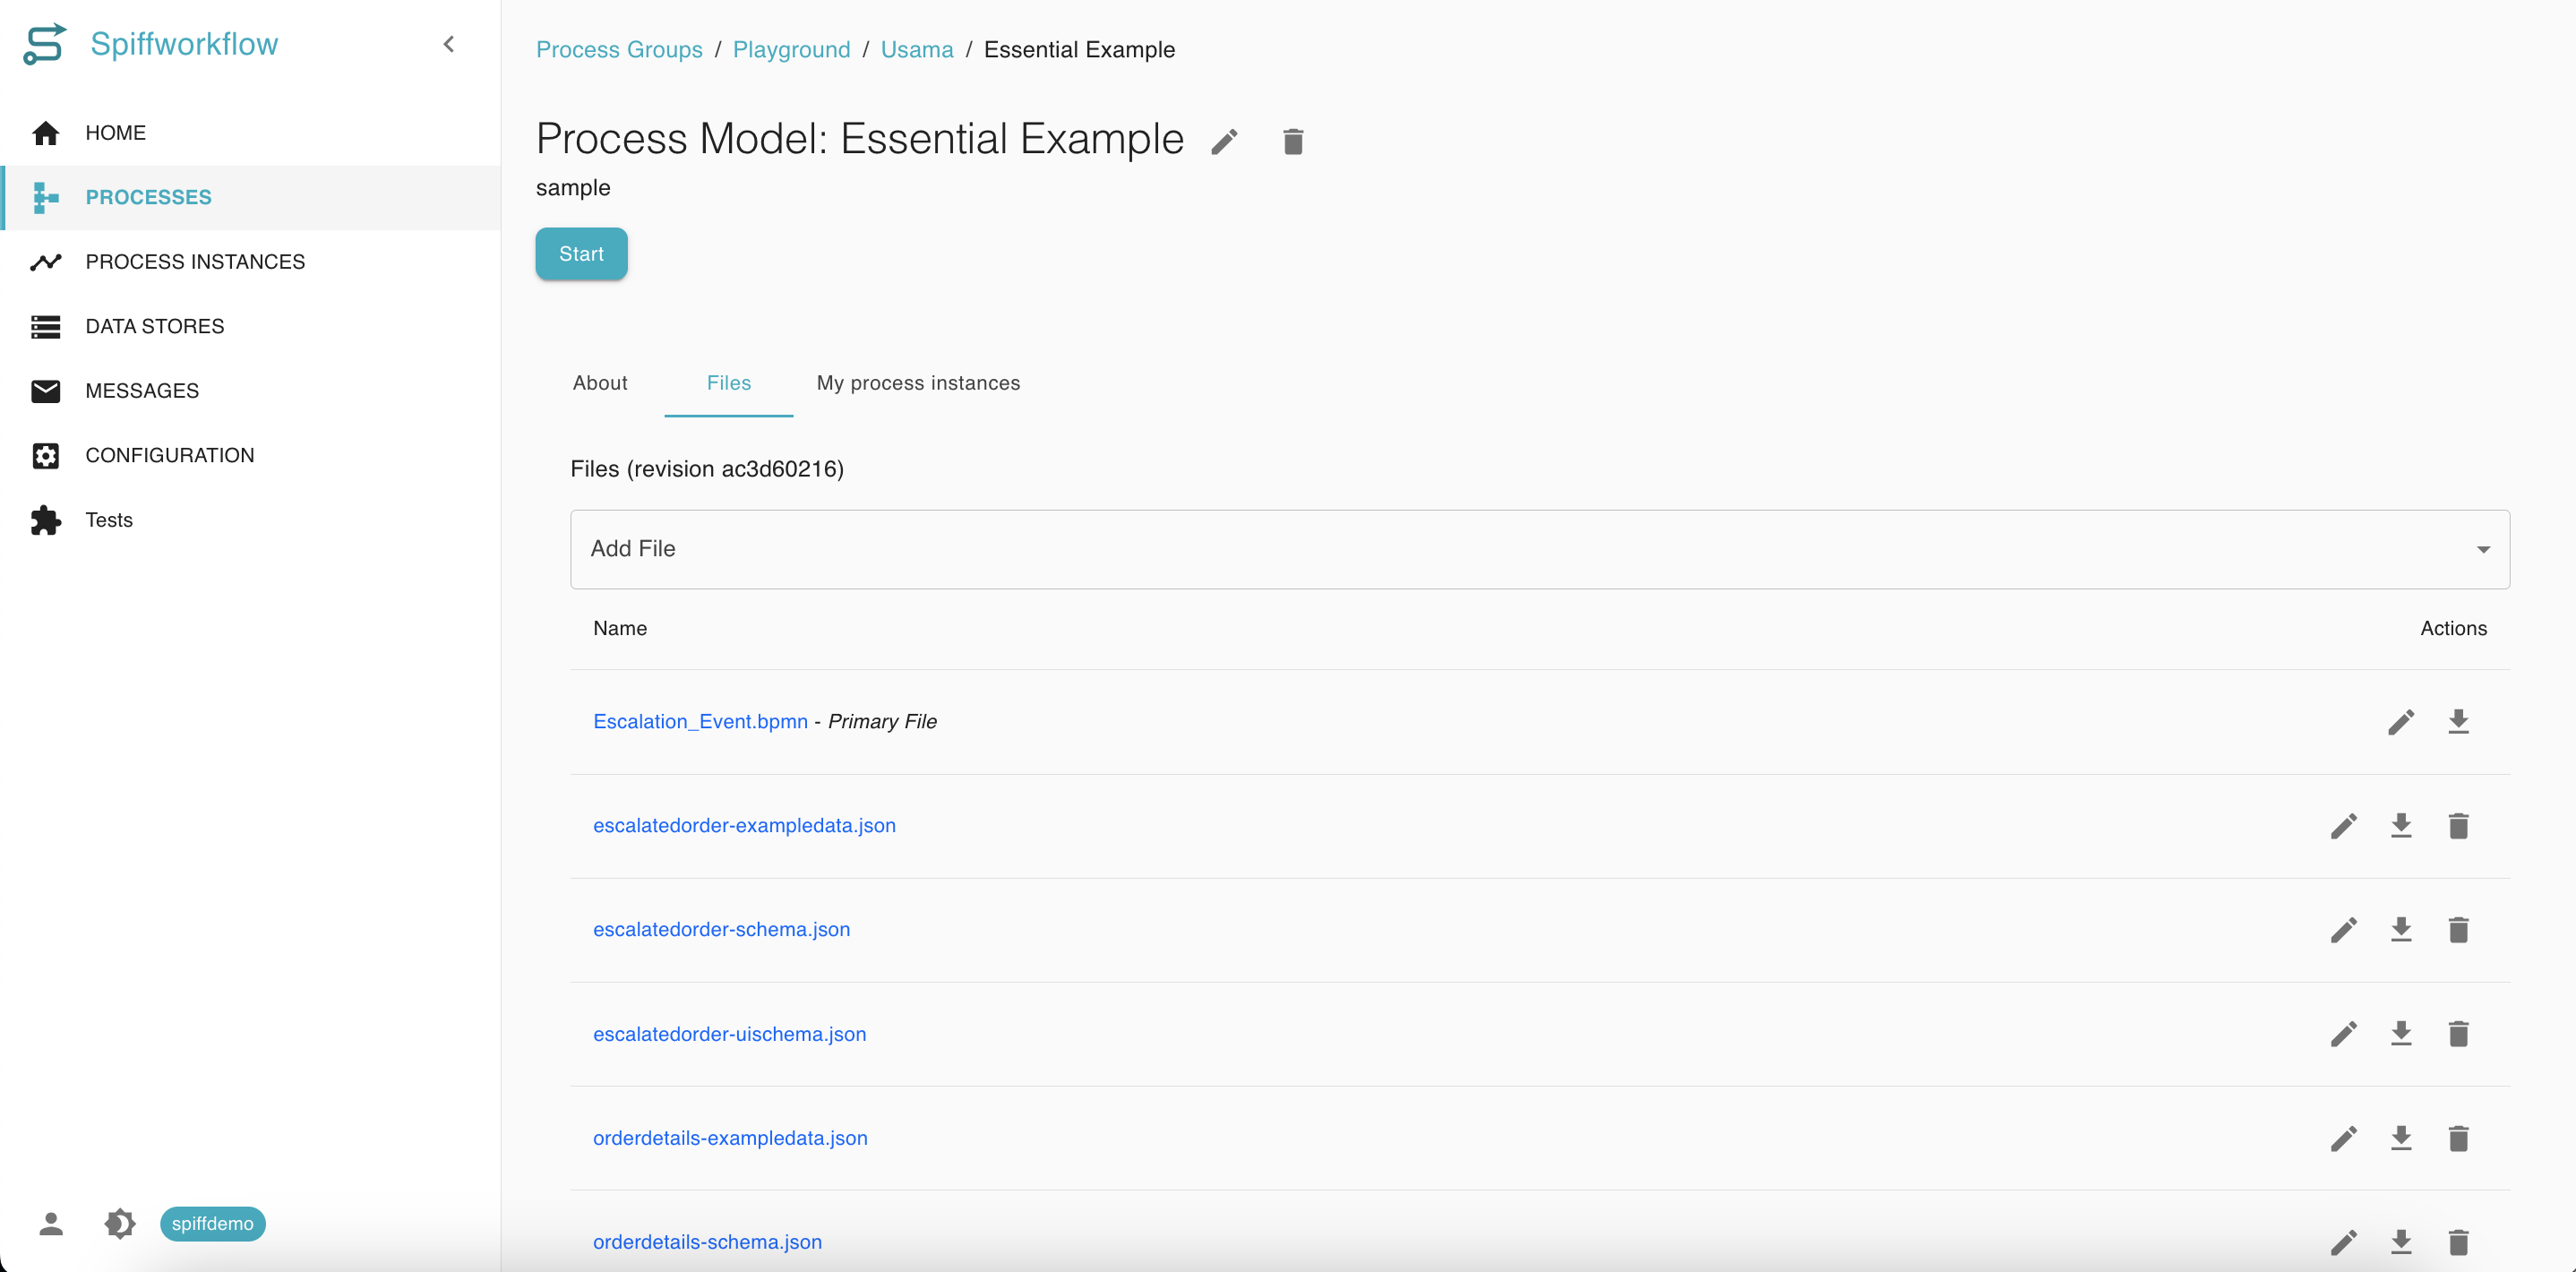
By following these simple steps, you can easily view process model files in SpiffWorkflow.
If you want to view or create information on specific process models, we allow you to create an ‘About’ section.
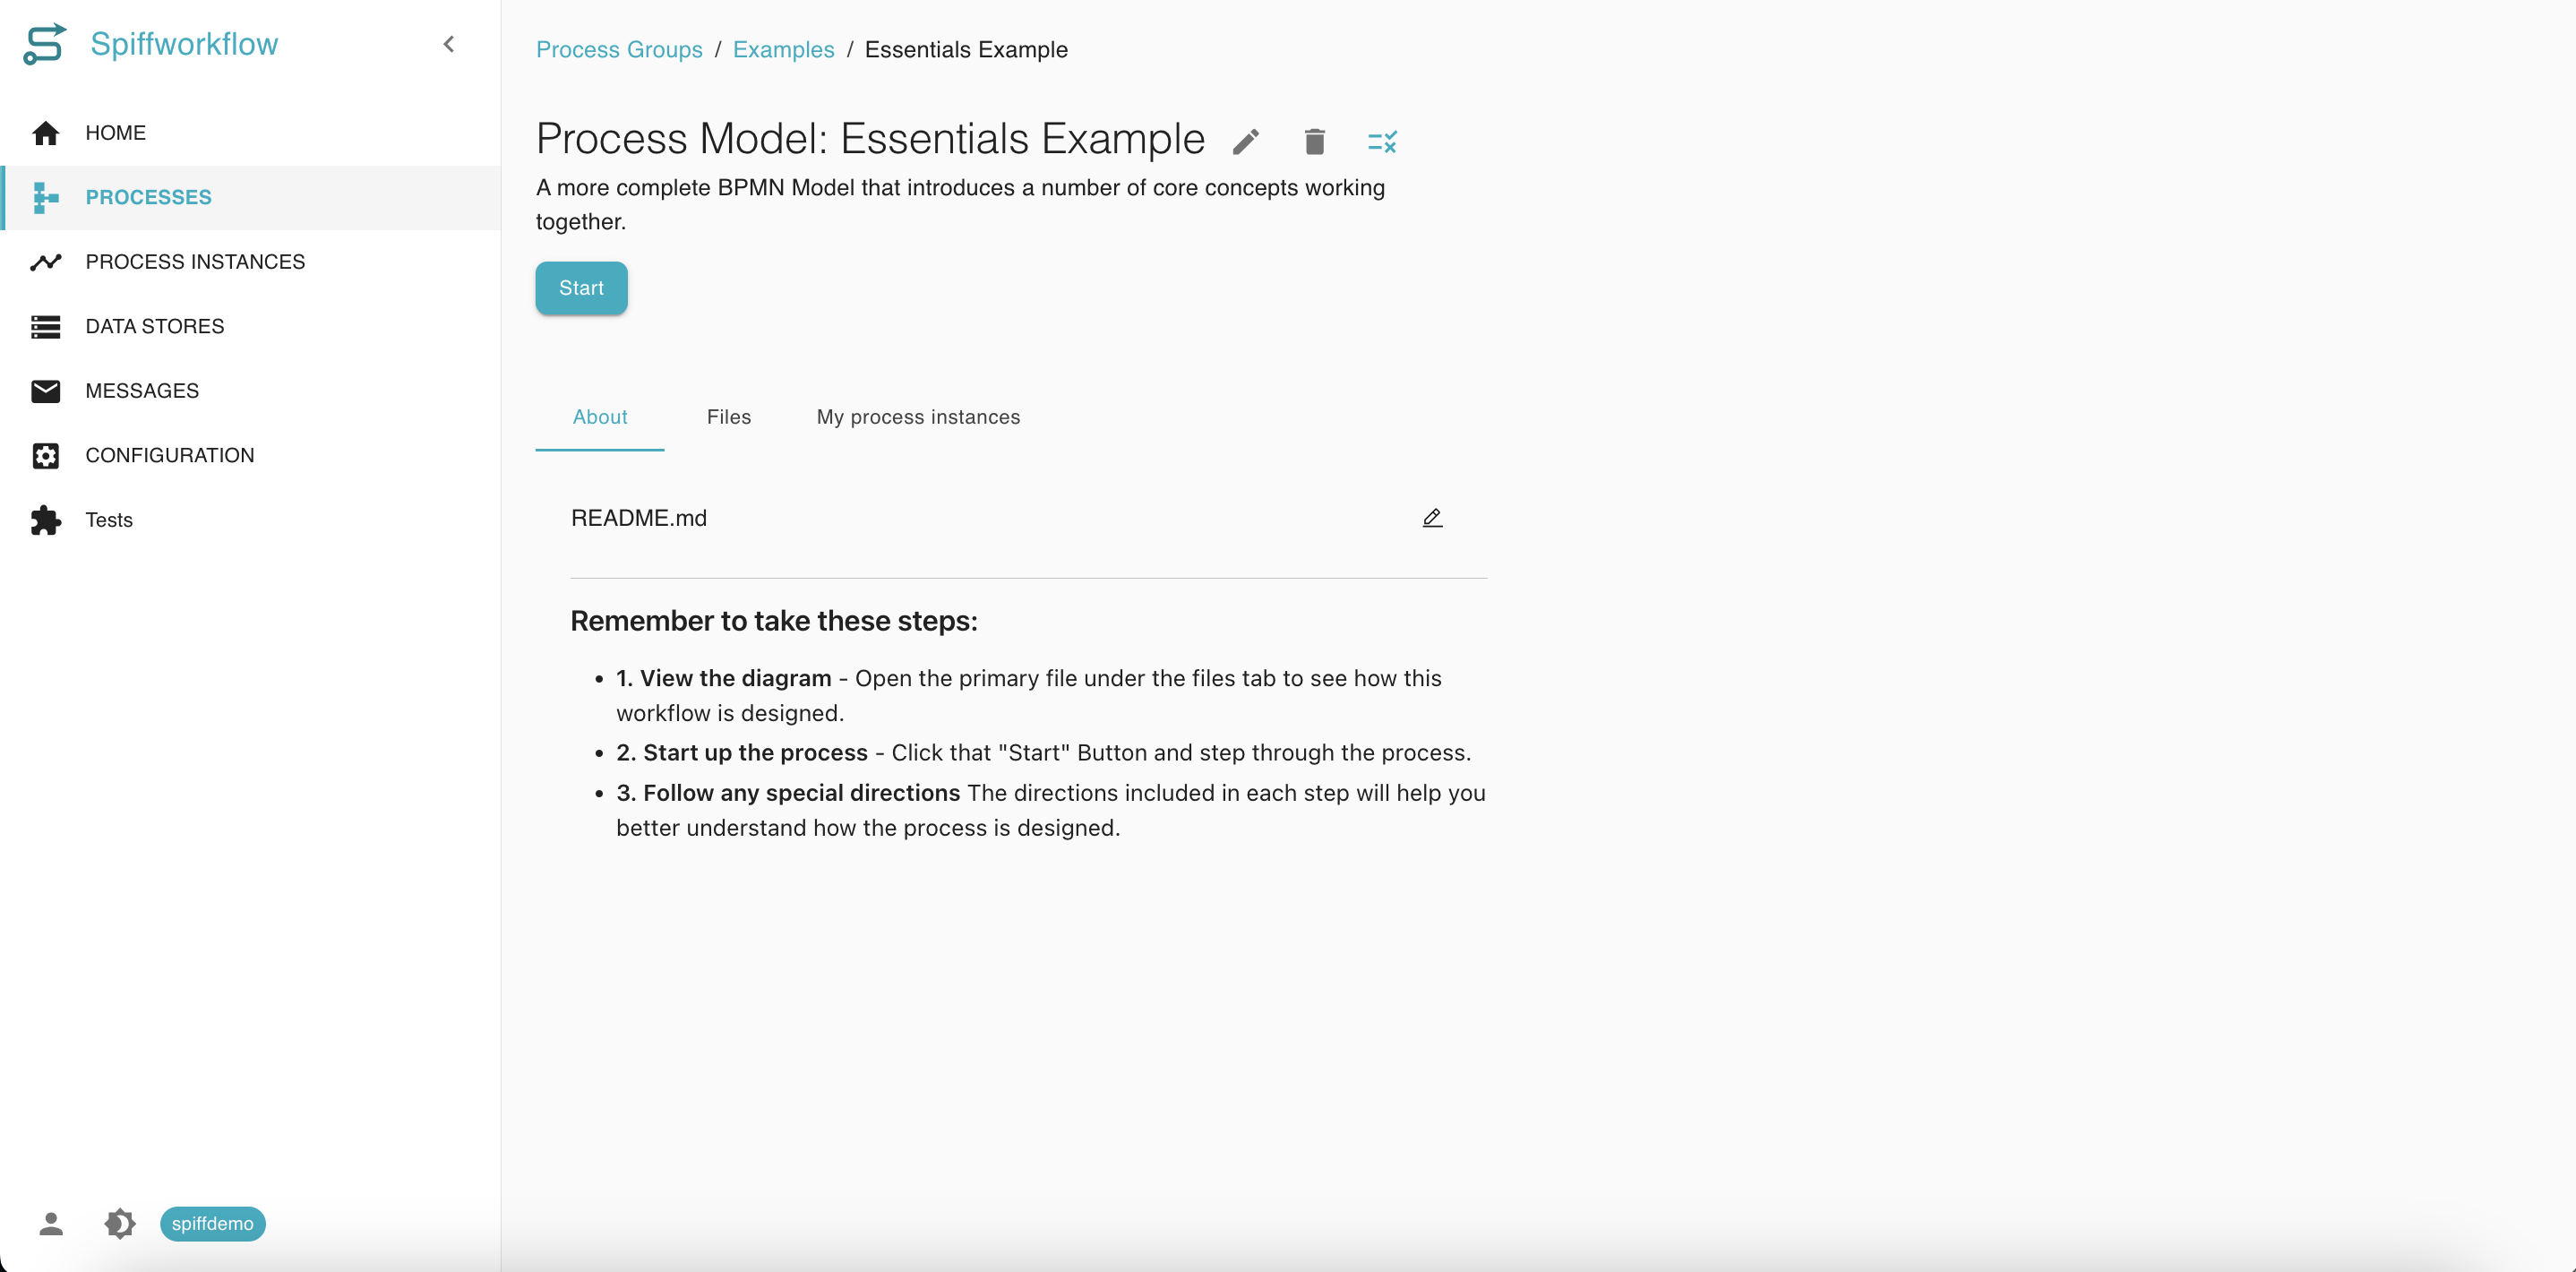
If you are creating a model, you can add information in the ‘About’ section.
We have integrated Markdown support, enabling you to create rich, formatted descriptions for your process models directly within the platform.
In order to use this feature, simply create a README file inside the process model called README.md and document the model, so everyone can be on the same page.
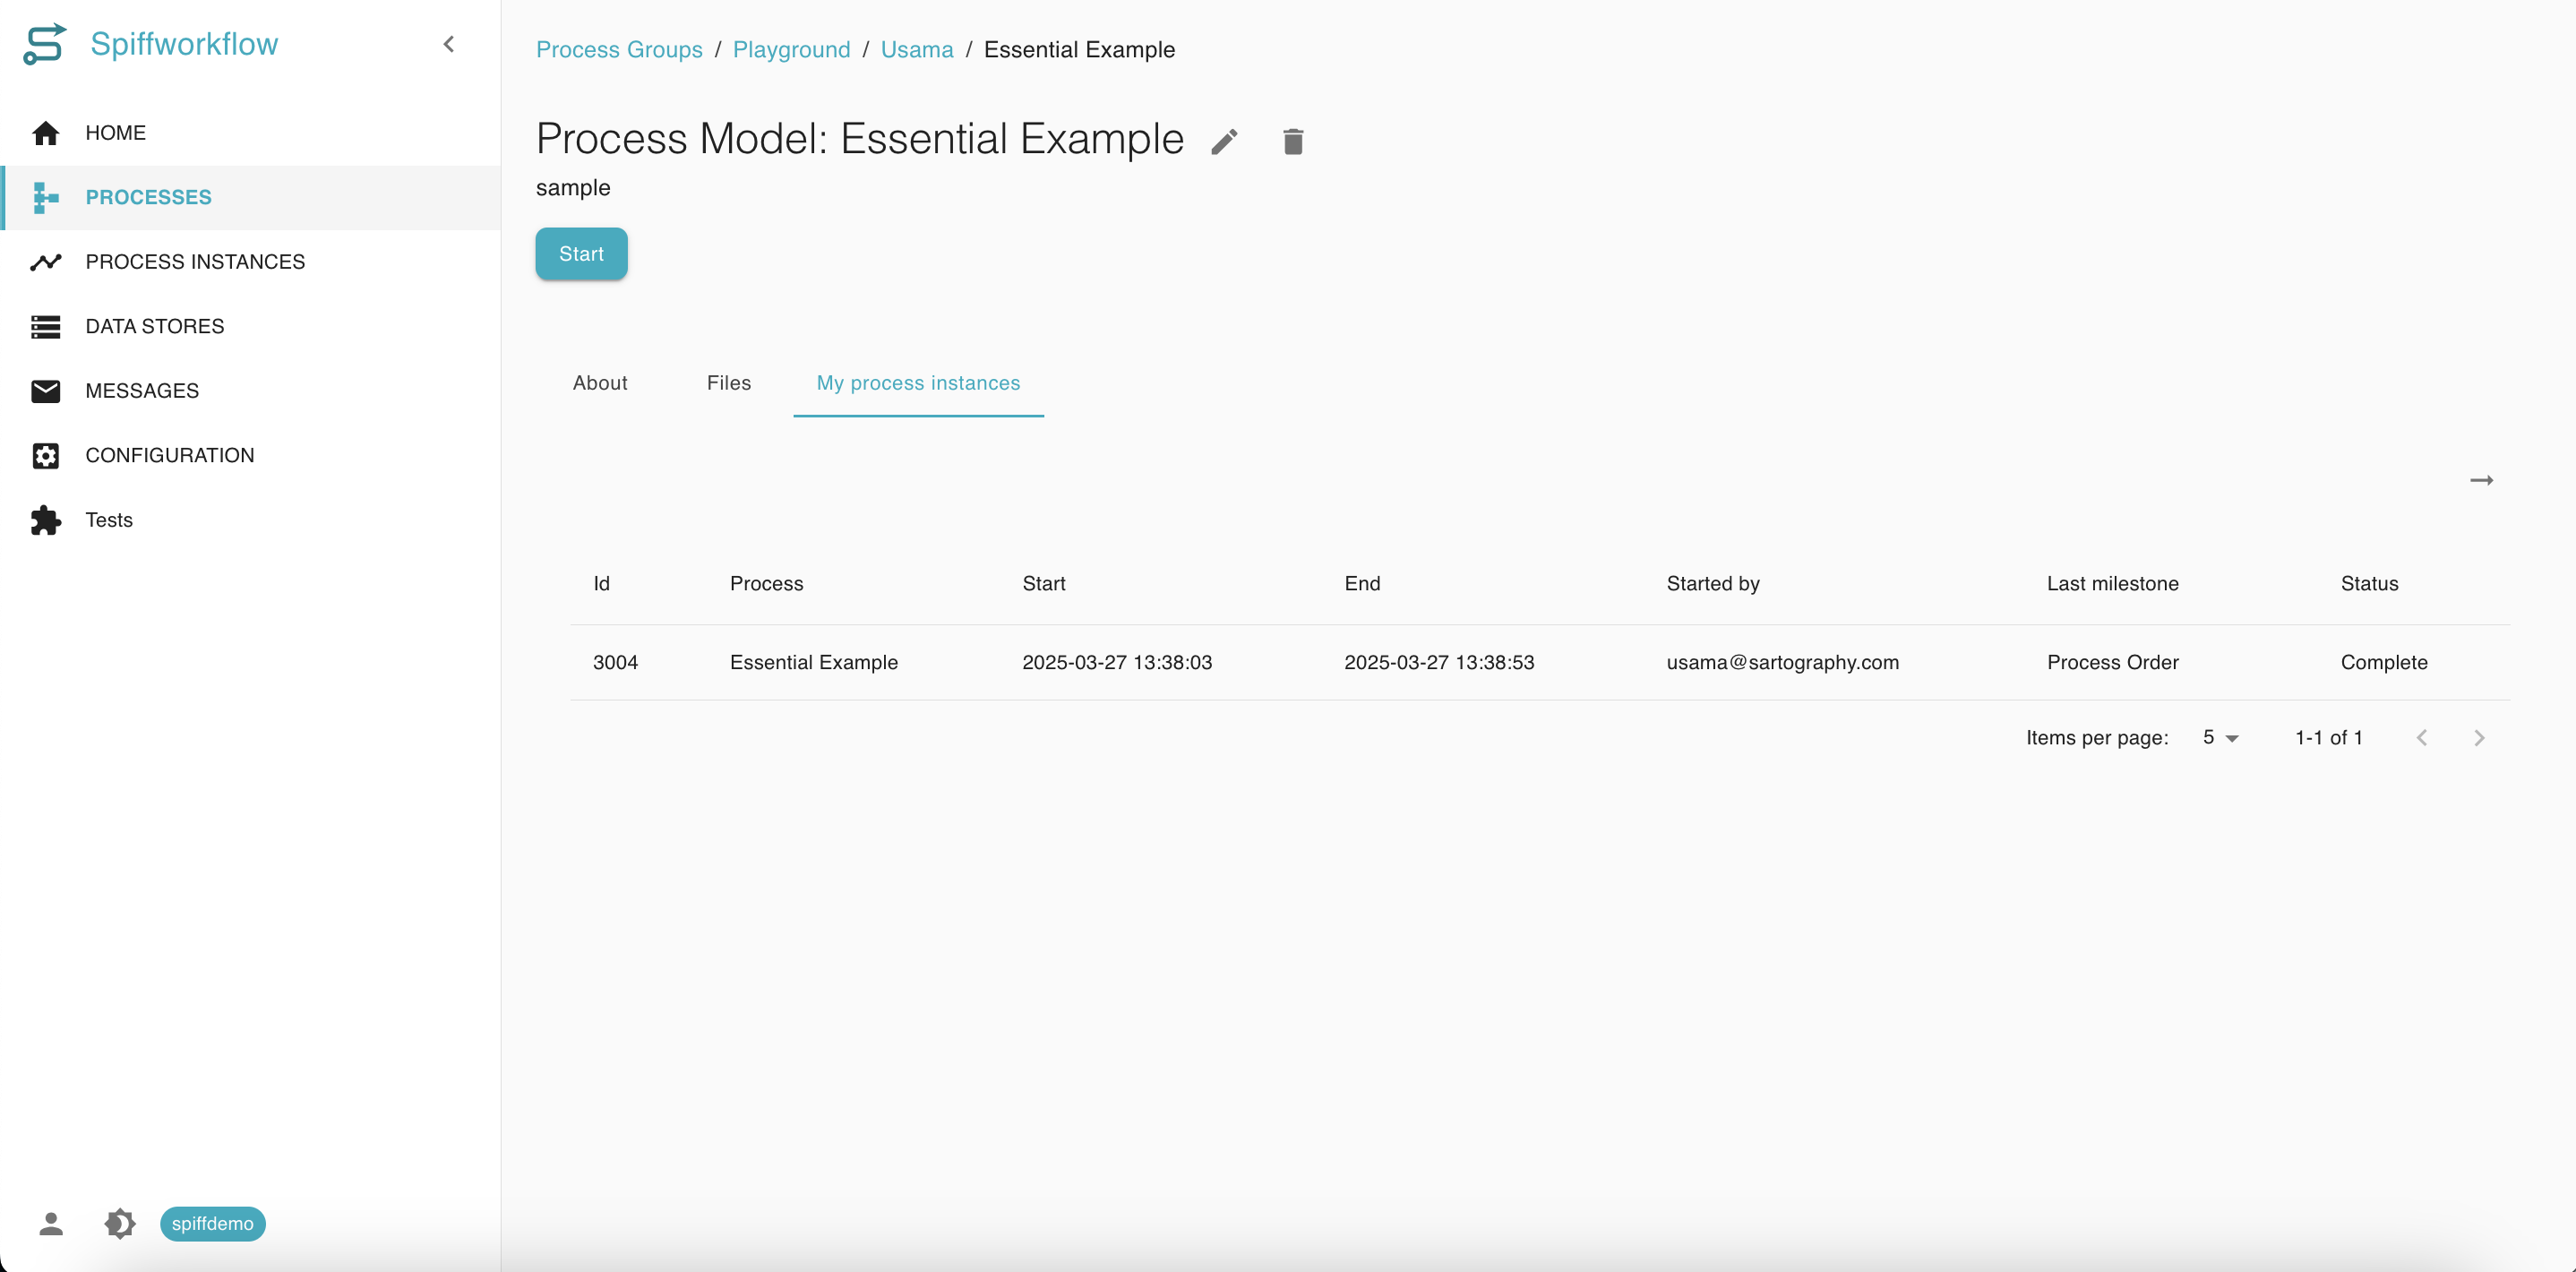
Furthermore, to check the process instances you started, you can also switch to the ‘My process instances’ tab.
How to view and filter process instances
As you work on various process instances in SpiffWorkflow, you may want to view and filter some of them. This can help you track the status of various instances and manage them more efficiently.
Here are the steps to view and filter process instances in SpiffWorkflow.
Step 1: Navigate to Process Instances
Once you are signed in, navigate to the “Process Instances” section.
Within the “Process Instances” section, you’ll see a list of all the instances for the processes you can access.
If you are on a home page, you can navigate to the table you wish to filter.
Look for the black funnel icon in the top right-hand corner above the table and click on the icon. By clicking on the filter icon, you’ll be taken to a full-screen process view.
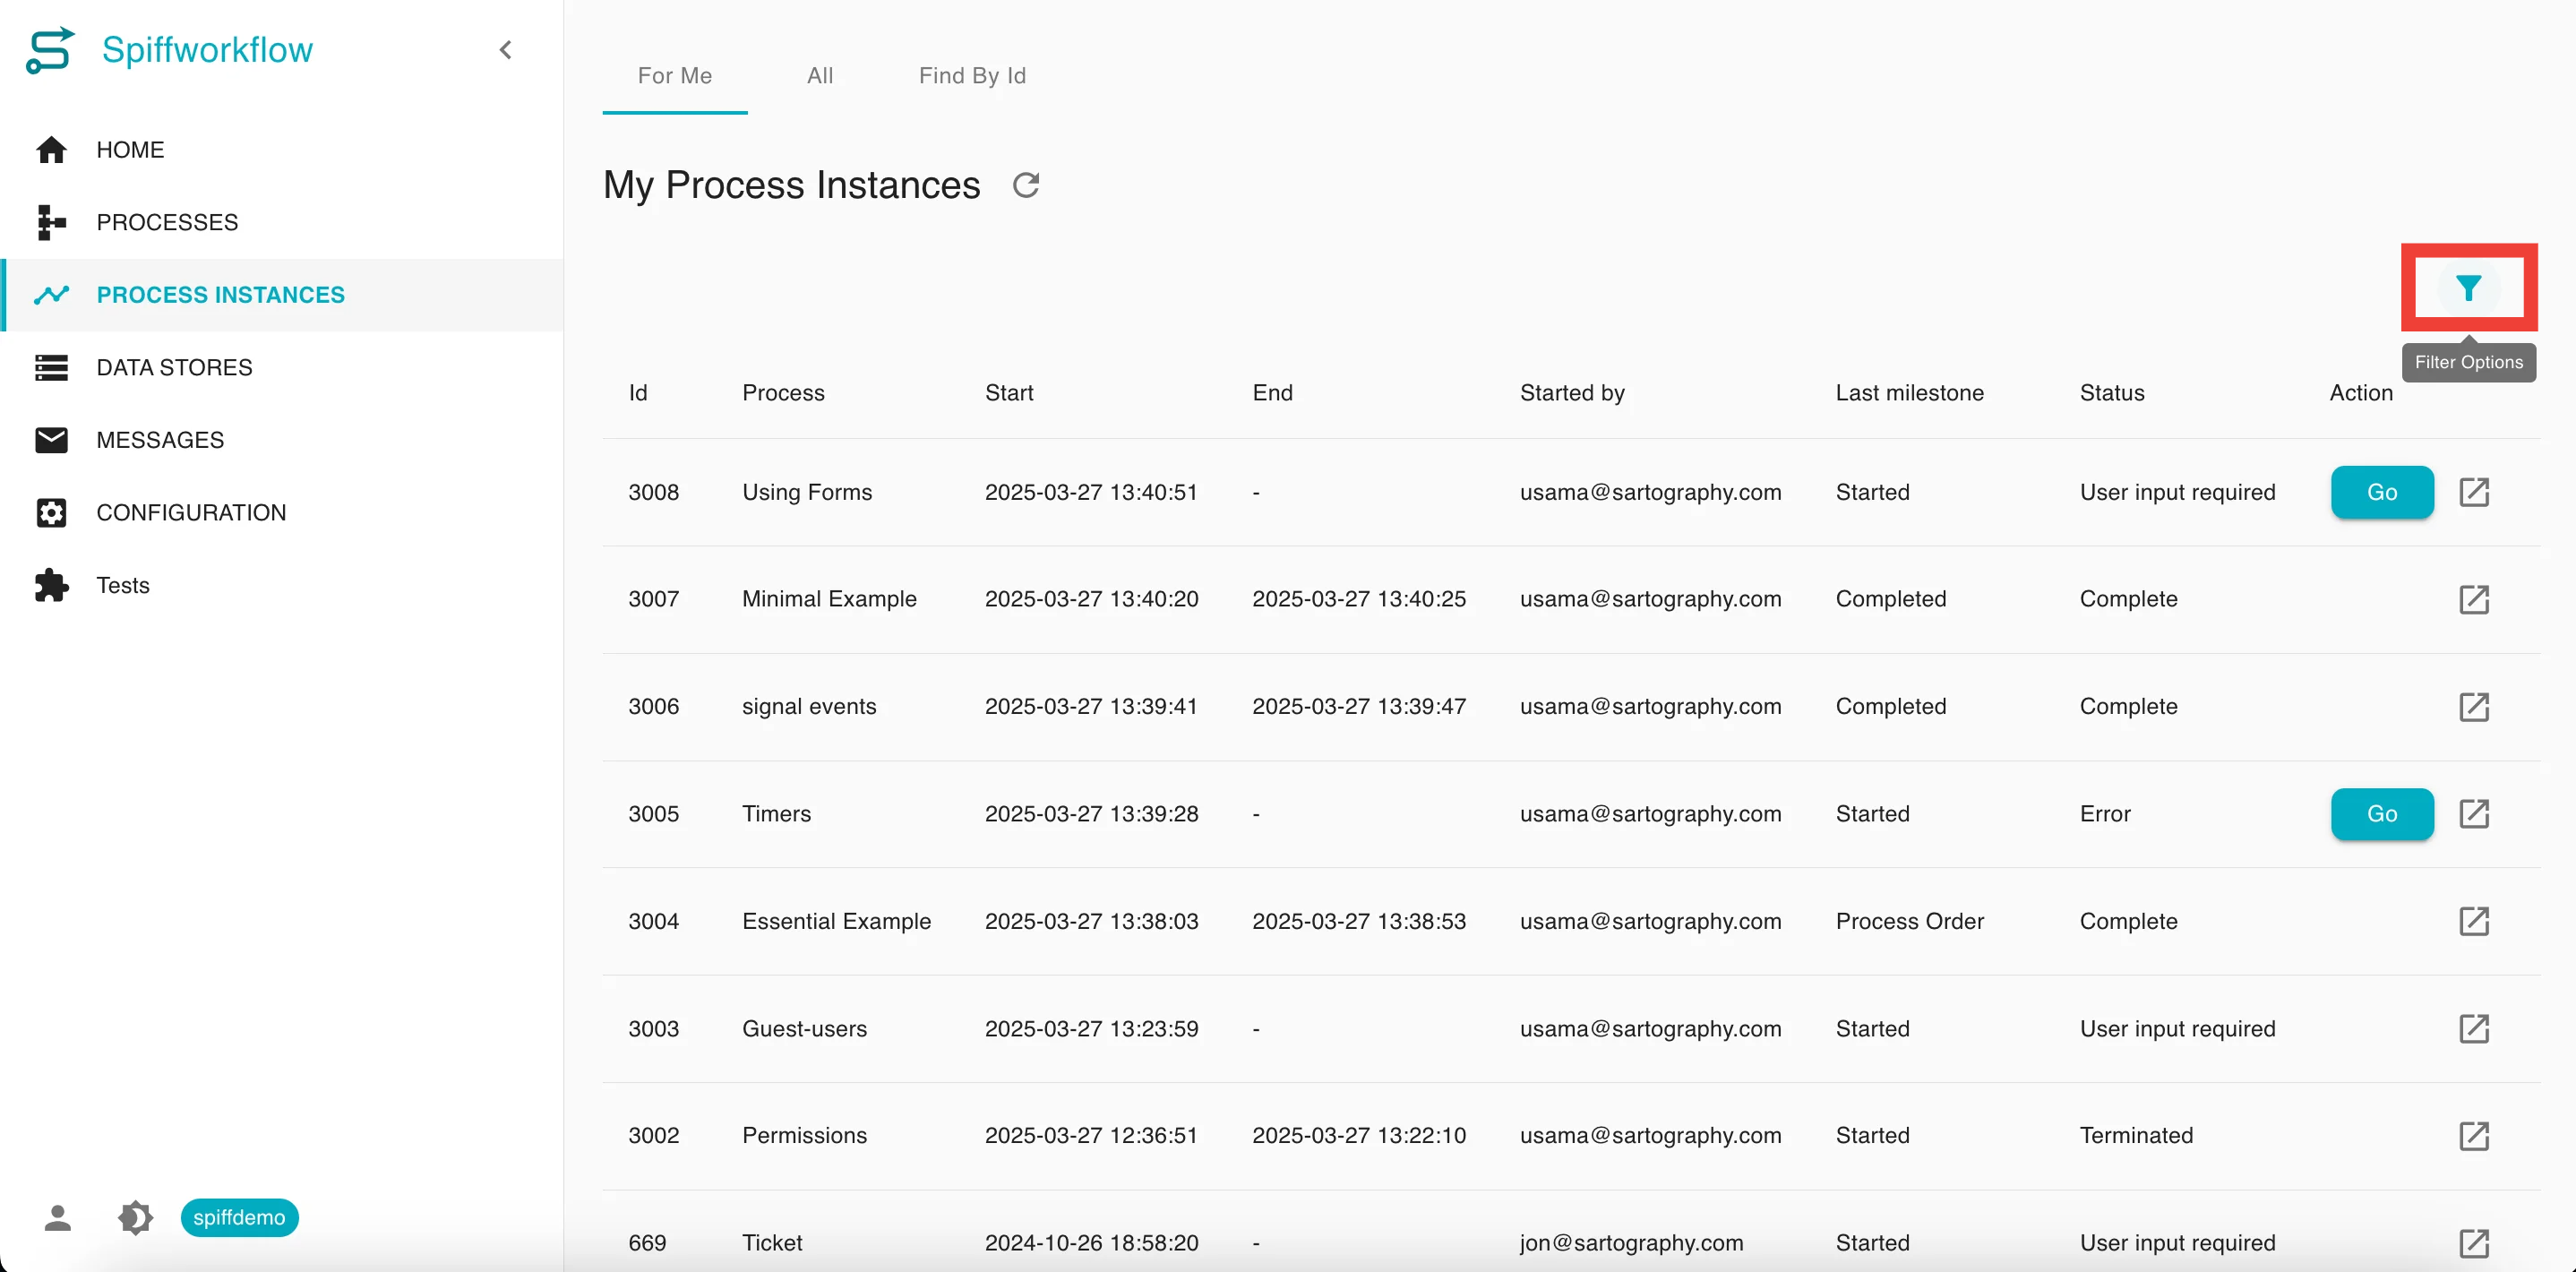
Step 2: Click on Filter option
To filter the list, click on the “Filter” option. This will expand the filter section where you will be able to provide details about the process instance. This allows you to enter various details, including the process model, start date, end date, and status. To refine your search, you can enter multiple filter parameters.
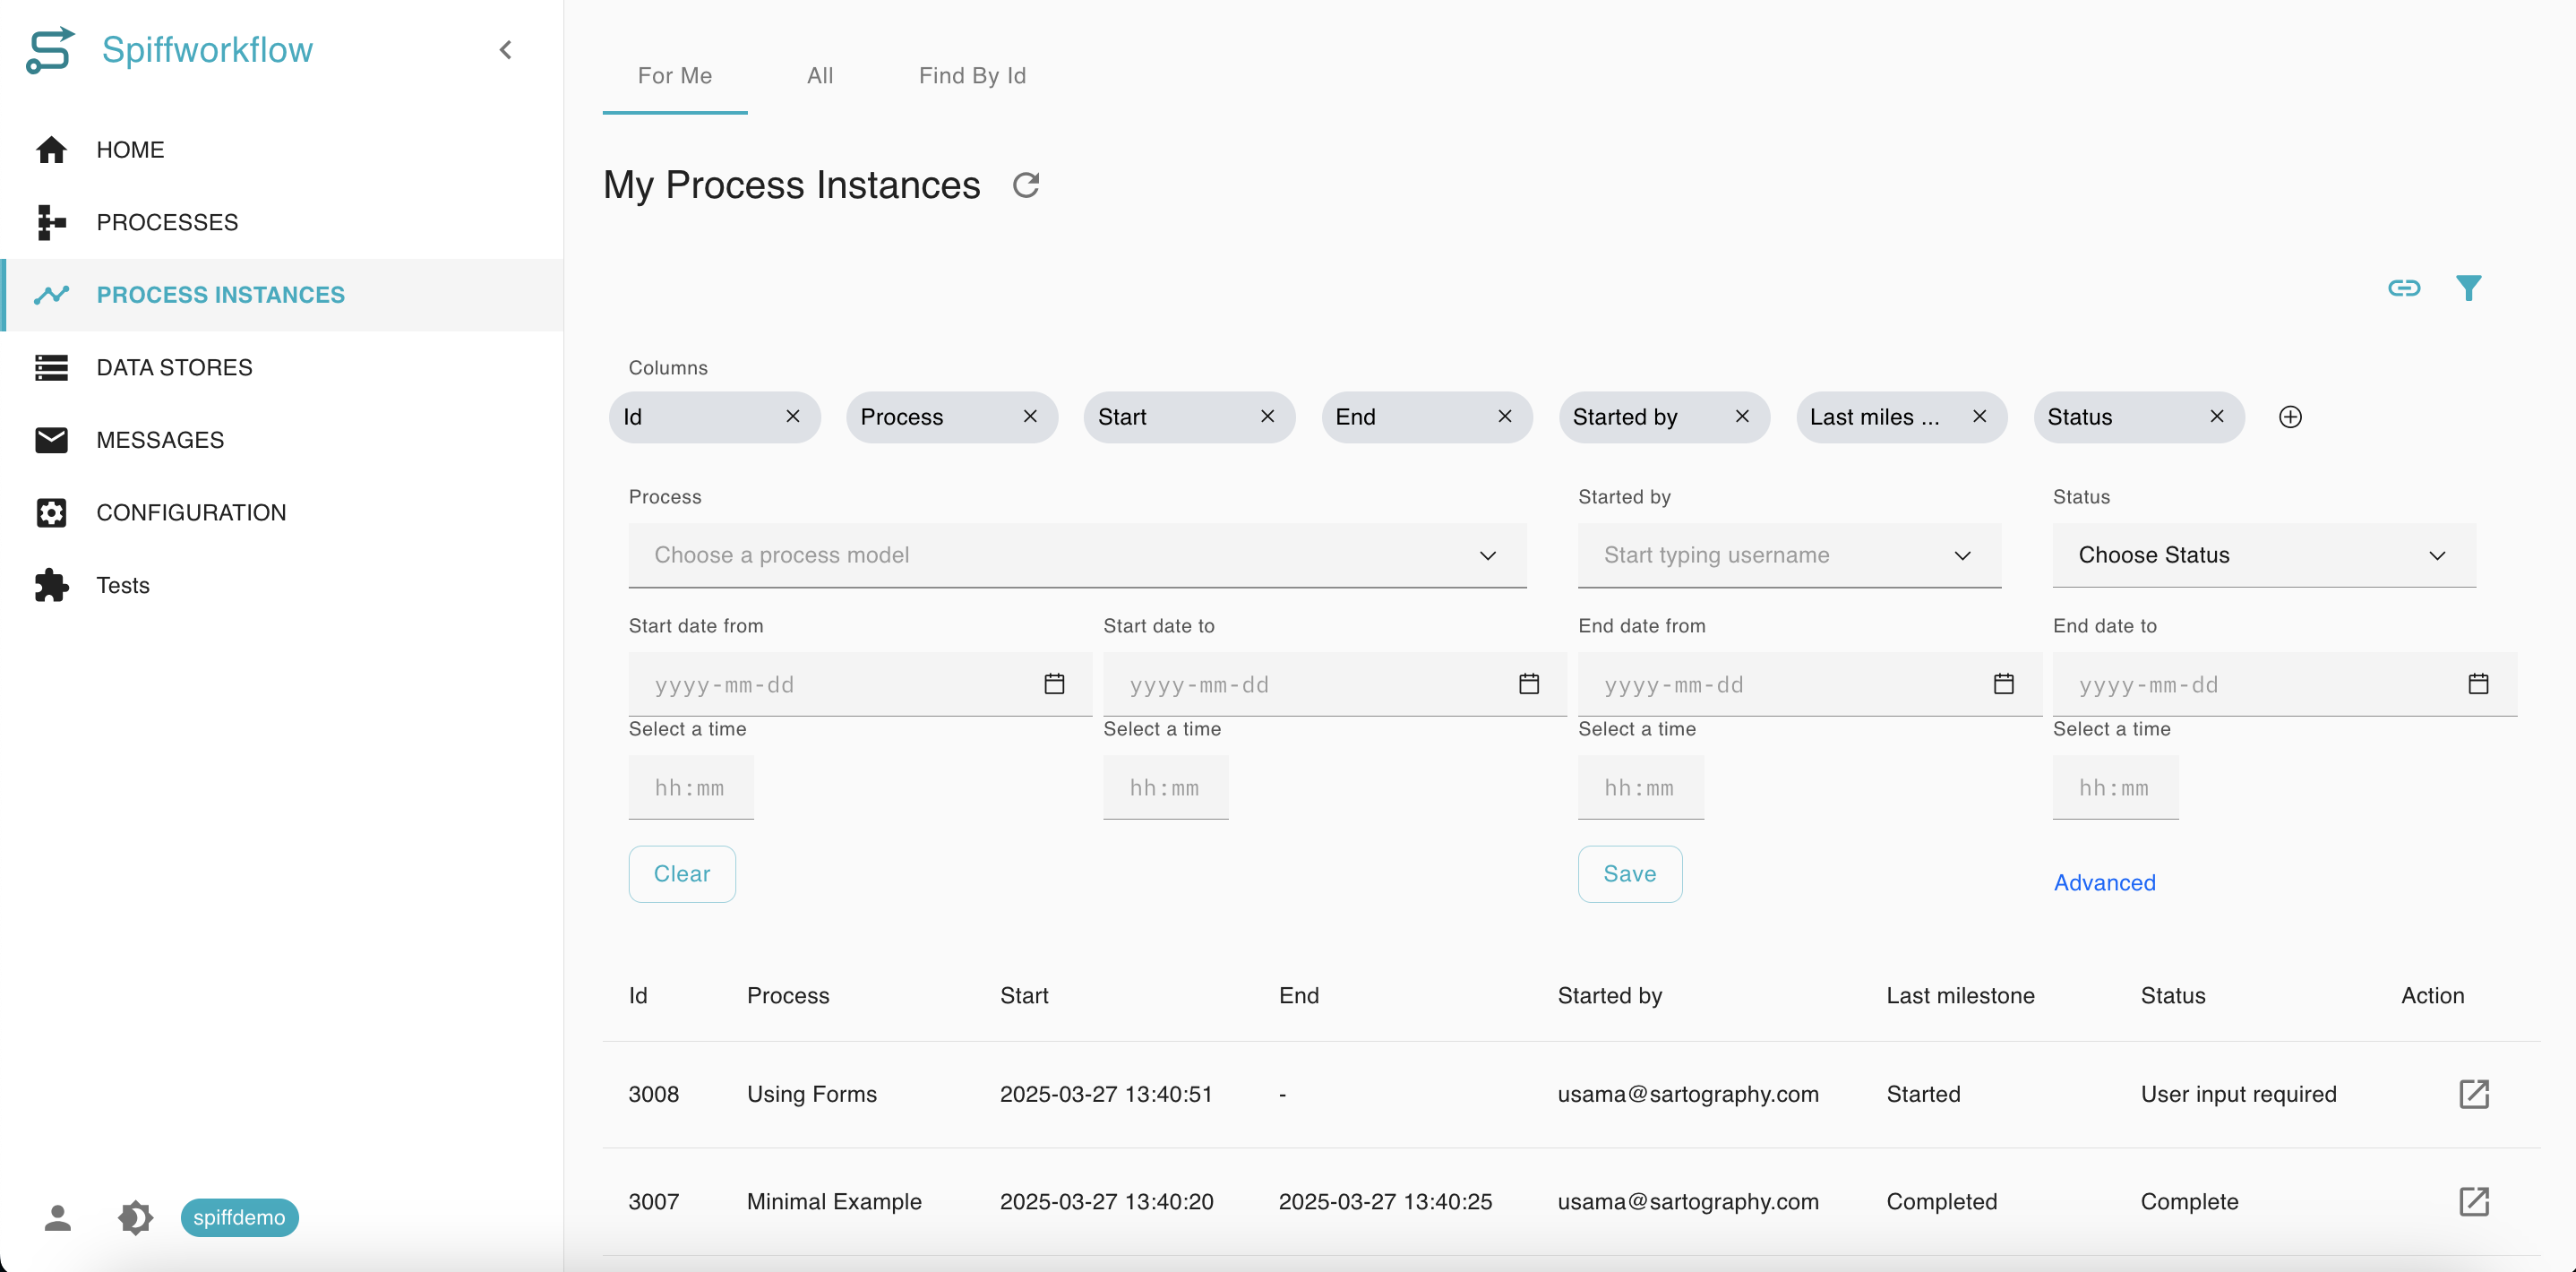
Step 3: Apply Filters
Once you have entered all the relevant filter details, click on the “Apply” button to apply the filters. The system will then display all the process instances matching the input details.
 To filter process instances by process-defined metadata, first ensure the metadata field is displayed as a column:
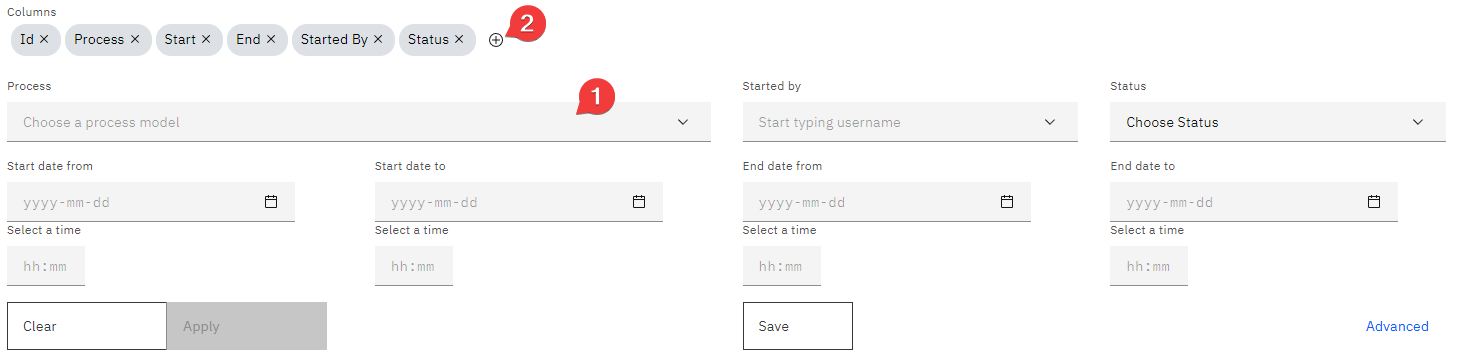
Search for the specific process you want to filter by and click on the Columns button to select metadata options.
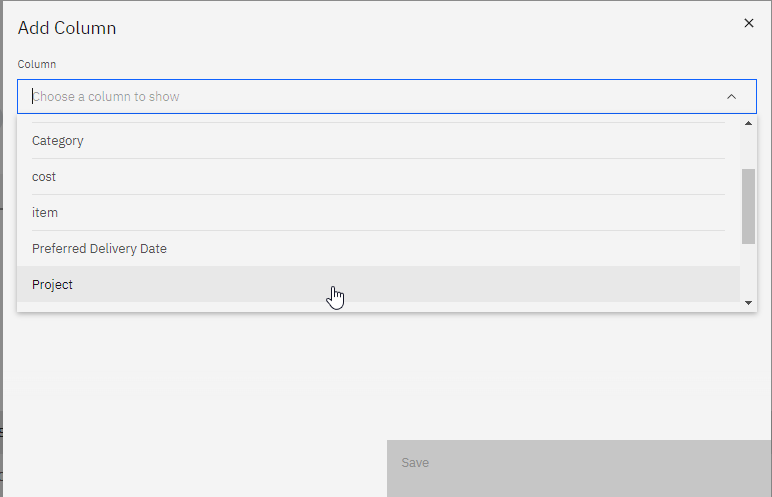
The metadata fields will be displayed in the dropdown. Select the desired metadata field from the dropdown and click Save.
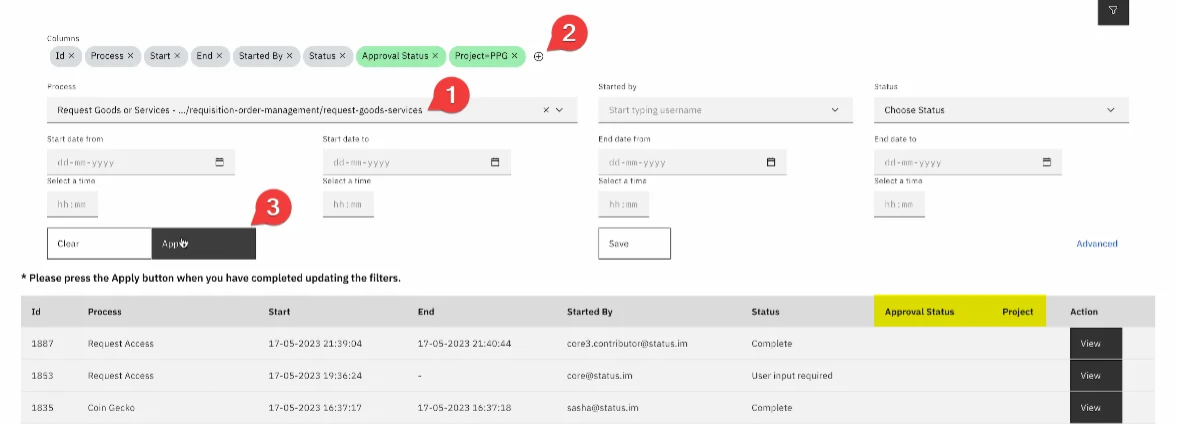
After saving, the new column will be displayed. You can now use the filter controls for this column. Click the main Apply button to apply all filters.
(Optional) Step 4: Save Perspectives
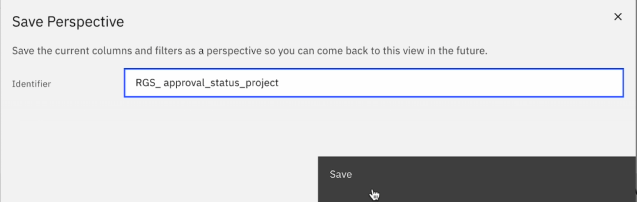
If you wish to save the perspectives, click on the “Save” button.
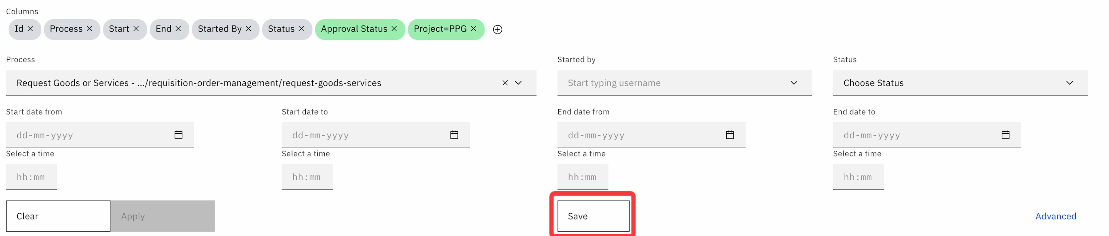
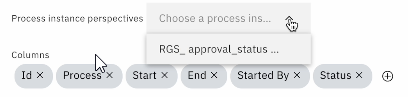
A prompt will appear, allowing you to provide a name for the perspective. Enter a descriptive name for the perspective and click Save. Now you can load this perspective later using the dropdown.
If you want to filter by ID, go to the “Find by Id” section of the page. Enter the ID and click “Submit”. The system will show you the process instance with the corresponding ID.
You can now view the process instances that you filtered for and take appropriate action based on their status.
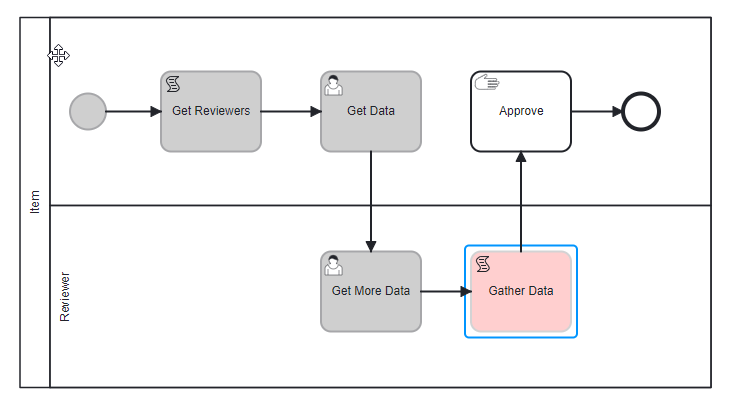
How to Interpret Colors in a BPMN Diagram
One of the key features of BPMN diagrams in SpiffWorkflow is the use of colors to represent different states or statuses of process instances.
Here are the colors used in BPMN Process:
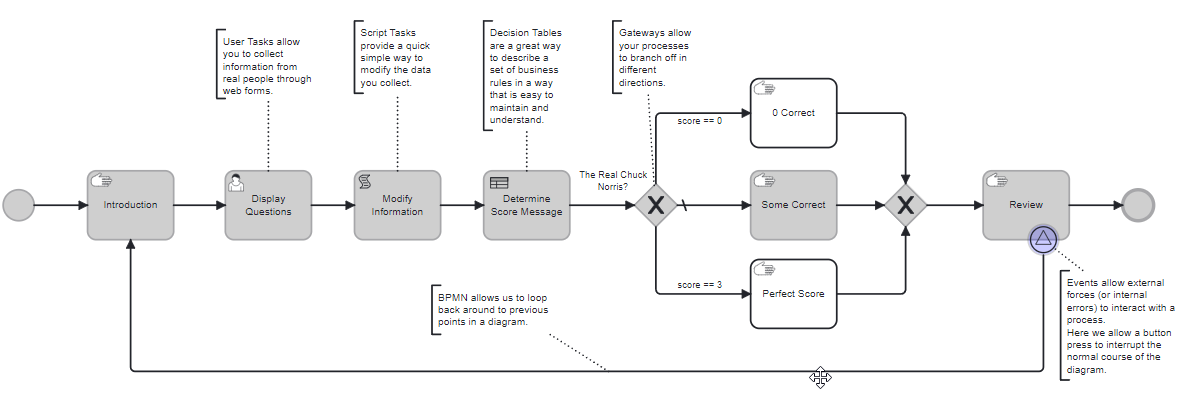
Grey Color:
Meaning: The task is completed.
Implication: Tasks or activities associated with this process have been successfully completed, and no further action is required.
Yellow Color:
Meaning: The process instance has started and is currently in progress.
Implication: This color signifies that the task is active and ongoing. It may require monitoring or further inputs to proceed.
Red/Pink Color:
Meaning: Indicates errors in the task.
Implication: There might be issues or obstacles preventing the task from proceeding as expected. Immediate attention and troubleshooting may be required.
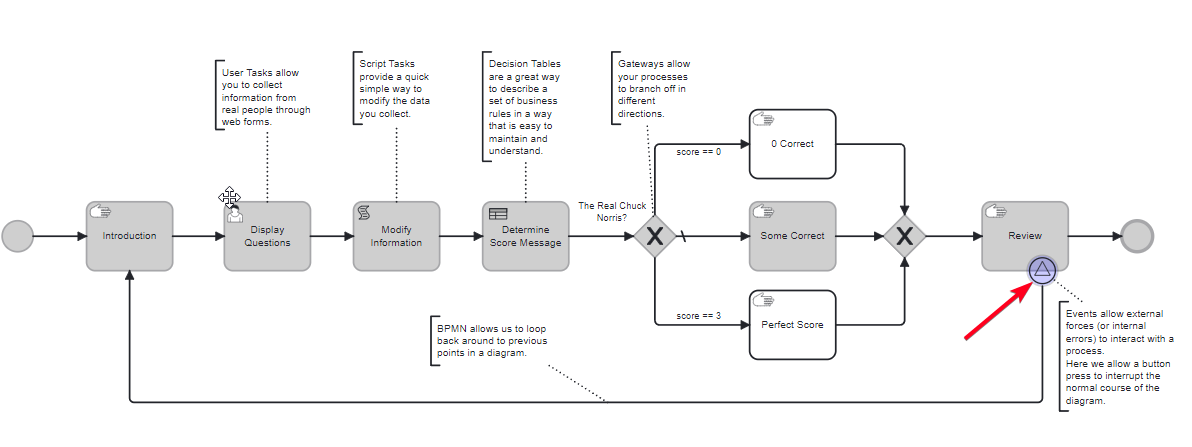
Purple Color:
Meaning: The activity has been canceled.
Implication: This task was intentionally stopped before completion. This could be due to time constraints, external triggers, or other predefined conditions that have been set as boundary events.
How to Check Milestones and Events
Milestones
A milestone is a specific point in a process that signifies a significant event or state. It provides a high-level overview of the progress made in the process.
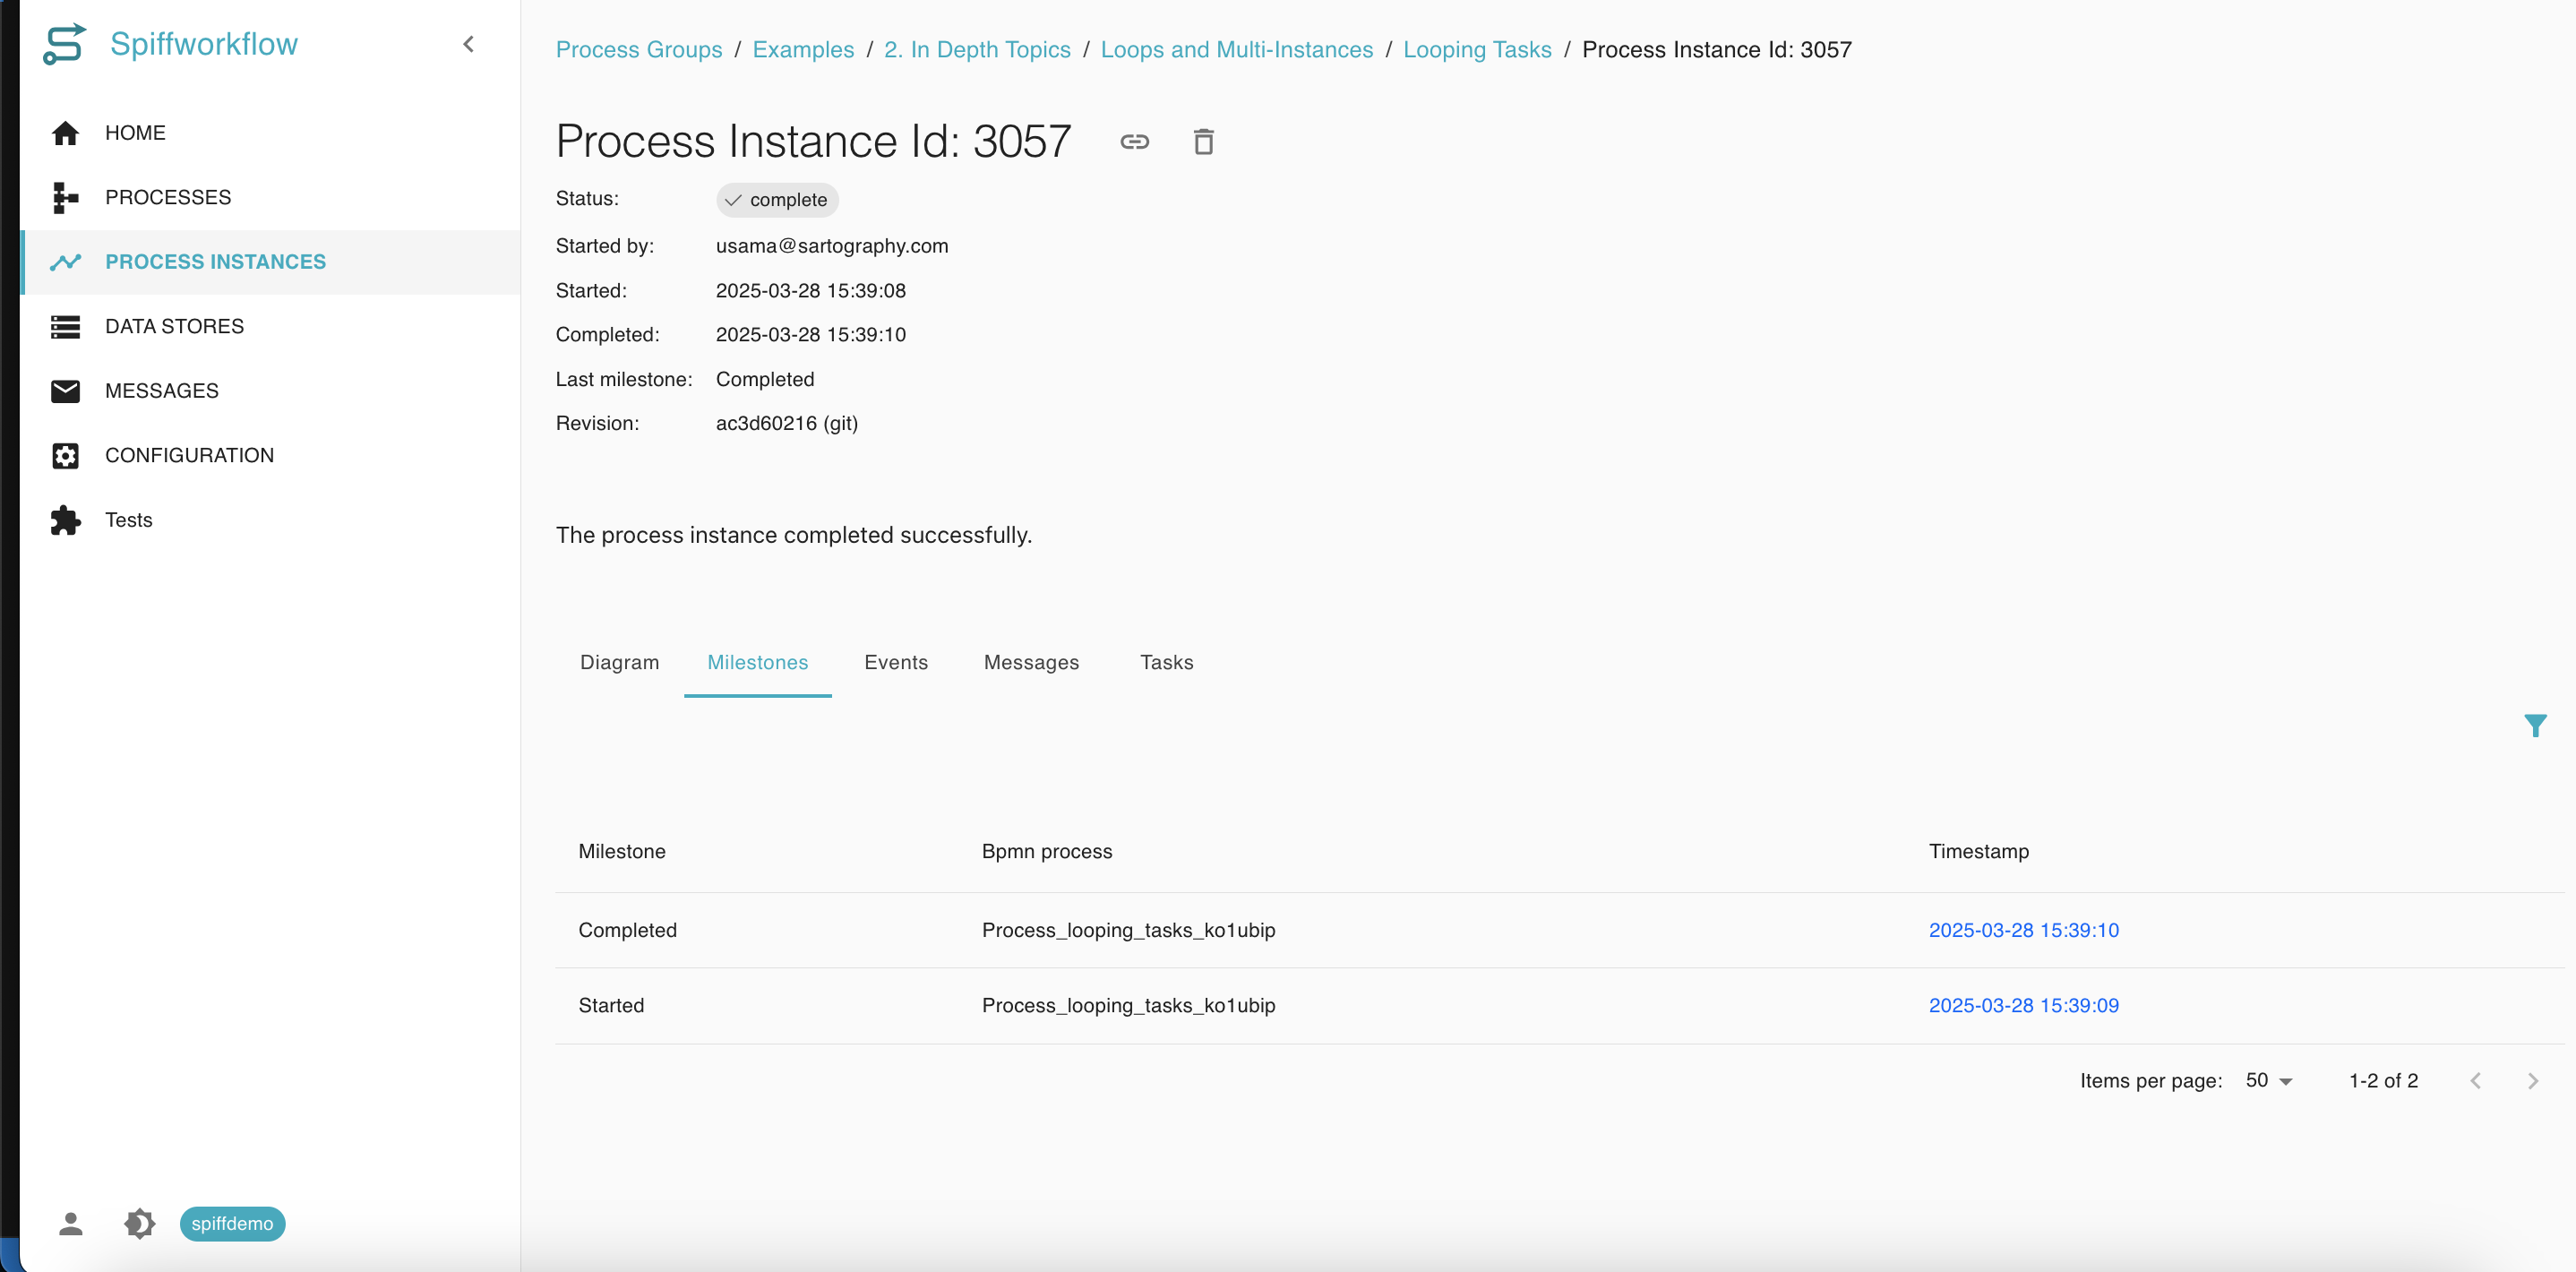
In BPMN, if you draw an intermediate event and do not specify its type (like message, signal, timer, or conditional) but give it a name, it becomes a milestone. Essentially, a milestone is a named, untyped intermediate throw event.
Events
Events provide a detailed log of everything that happens in a process. They record every task and its execution time.
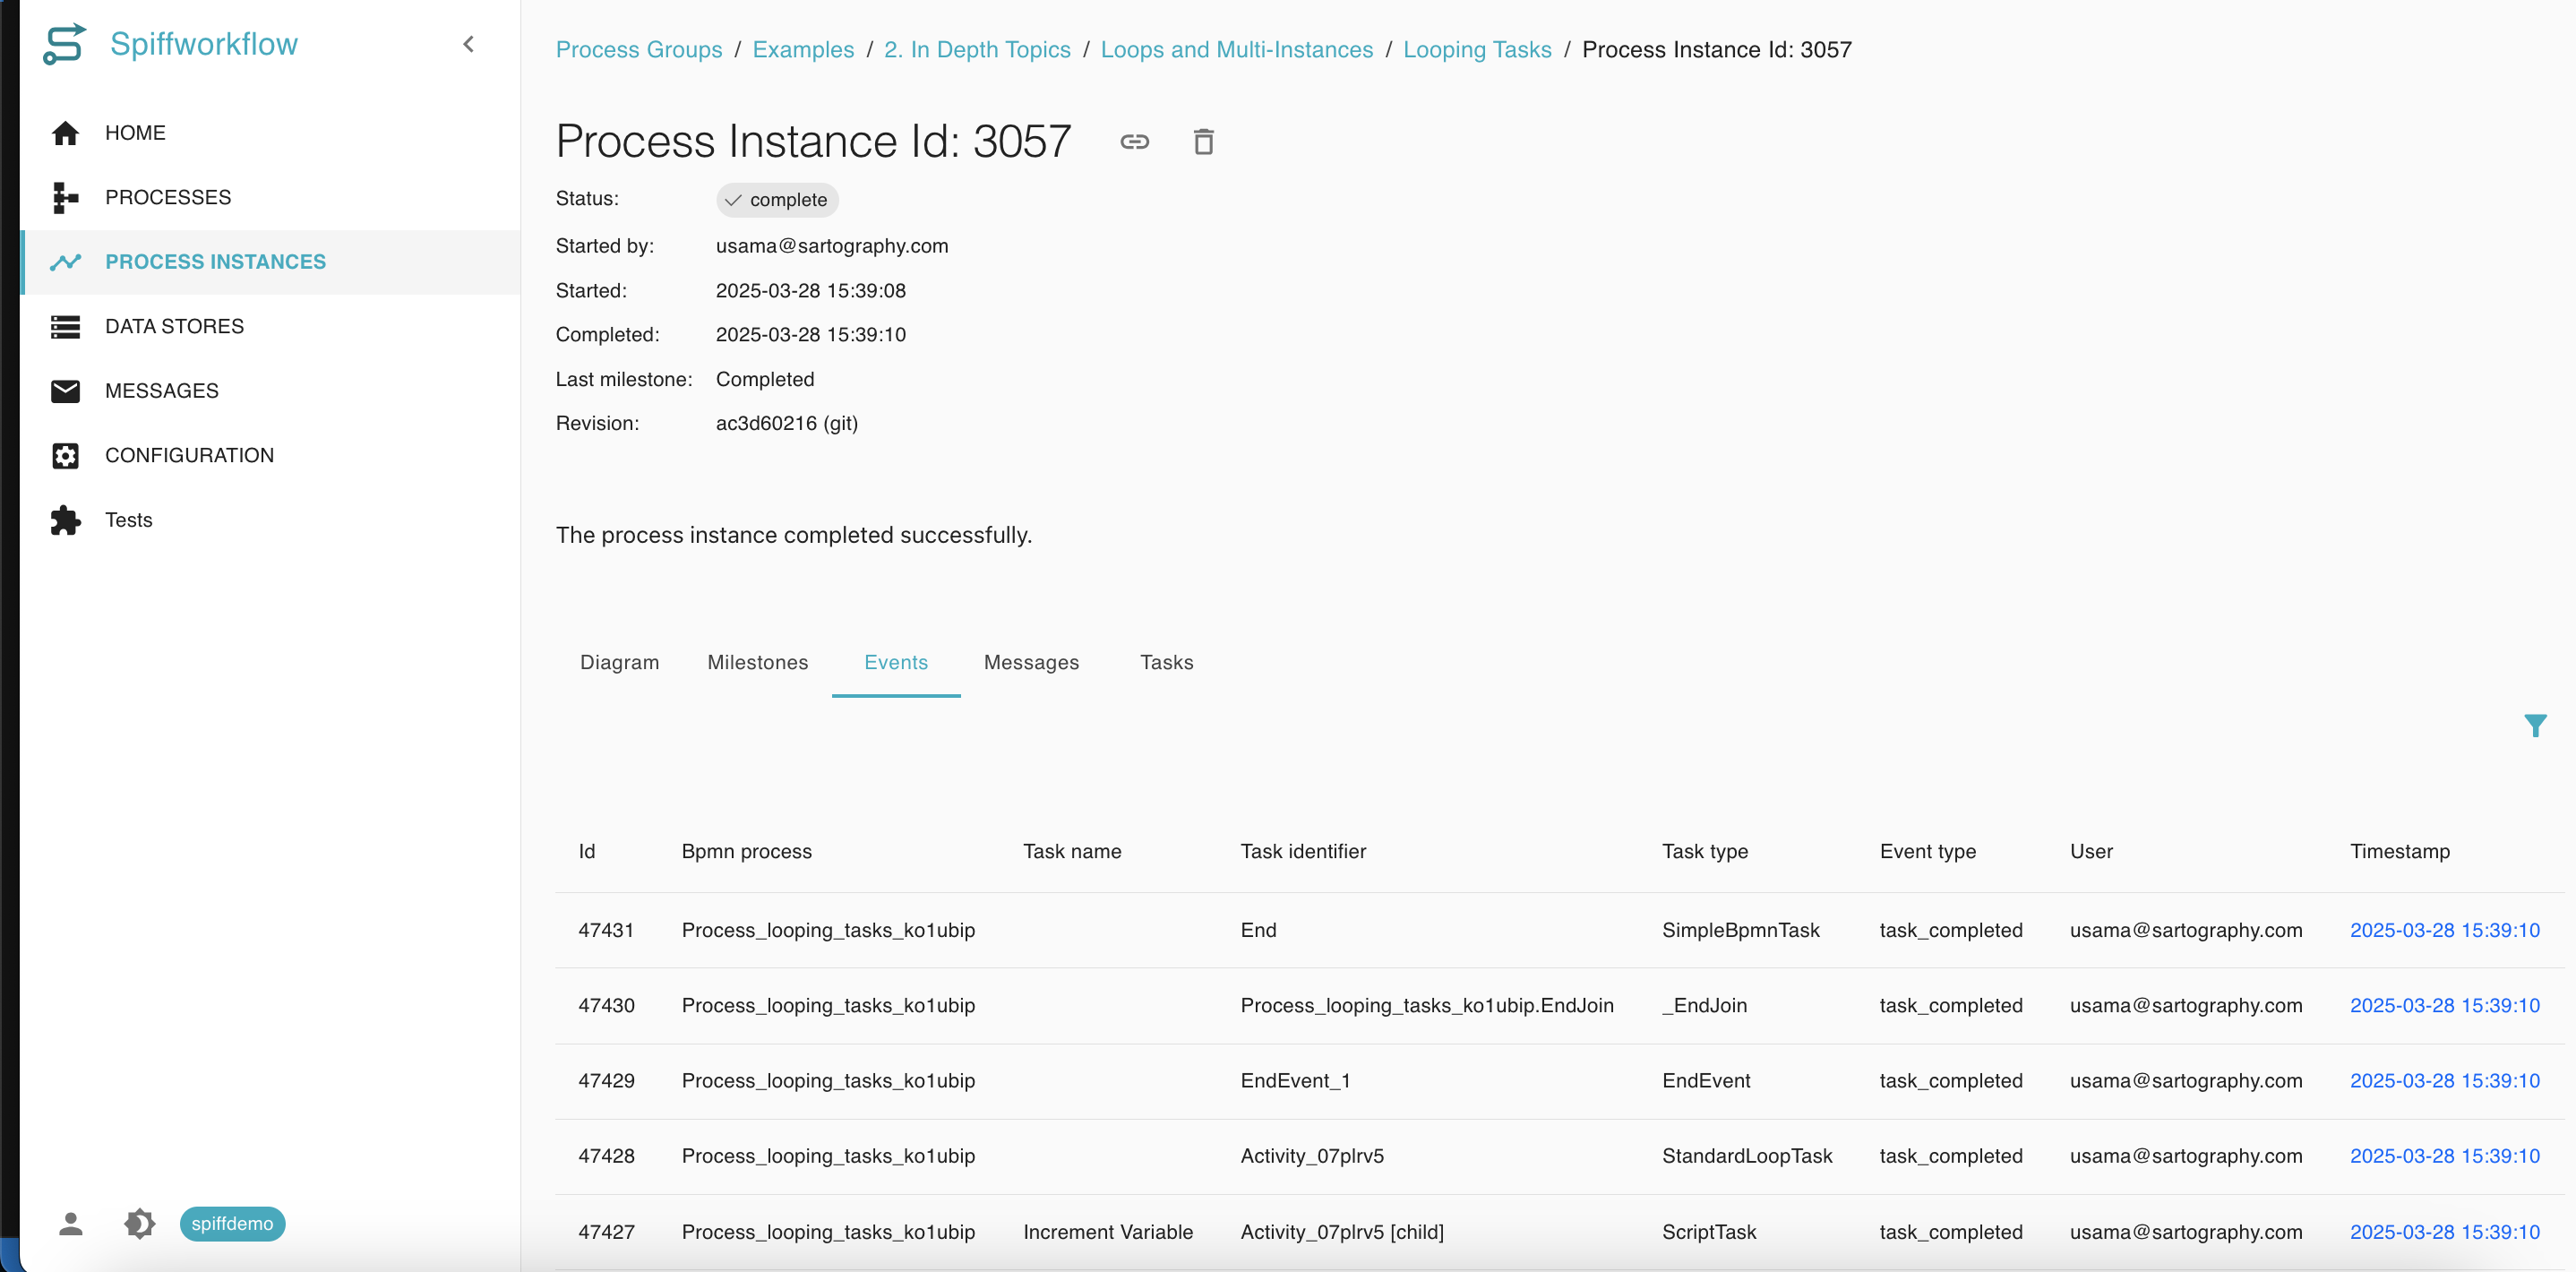
The ‘Events’ tab provides a detailed log of all the tasks and their execution times. It can be noisy due to the granularity of the information, but it’s essential for understanding the intricacies of the process.
How to Check Messages
Messages in BPMN allow processes to communicate with each other. This communication can take various forms:
Two processes running concurrently, exchanging messages.
One process initiating another through a message.
An external system making an API call, passing a payload (like a JSON data structure) that can either communicate with an ongoing process or initiate a new one.
The Waiter-Chef Illustration
To explain the concept, we are using a relatable example involving two processes: the Waiter and the Chef.
Waiter Process:
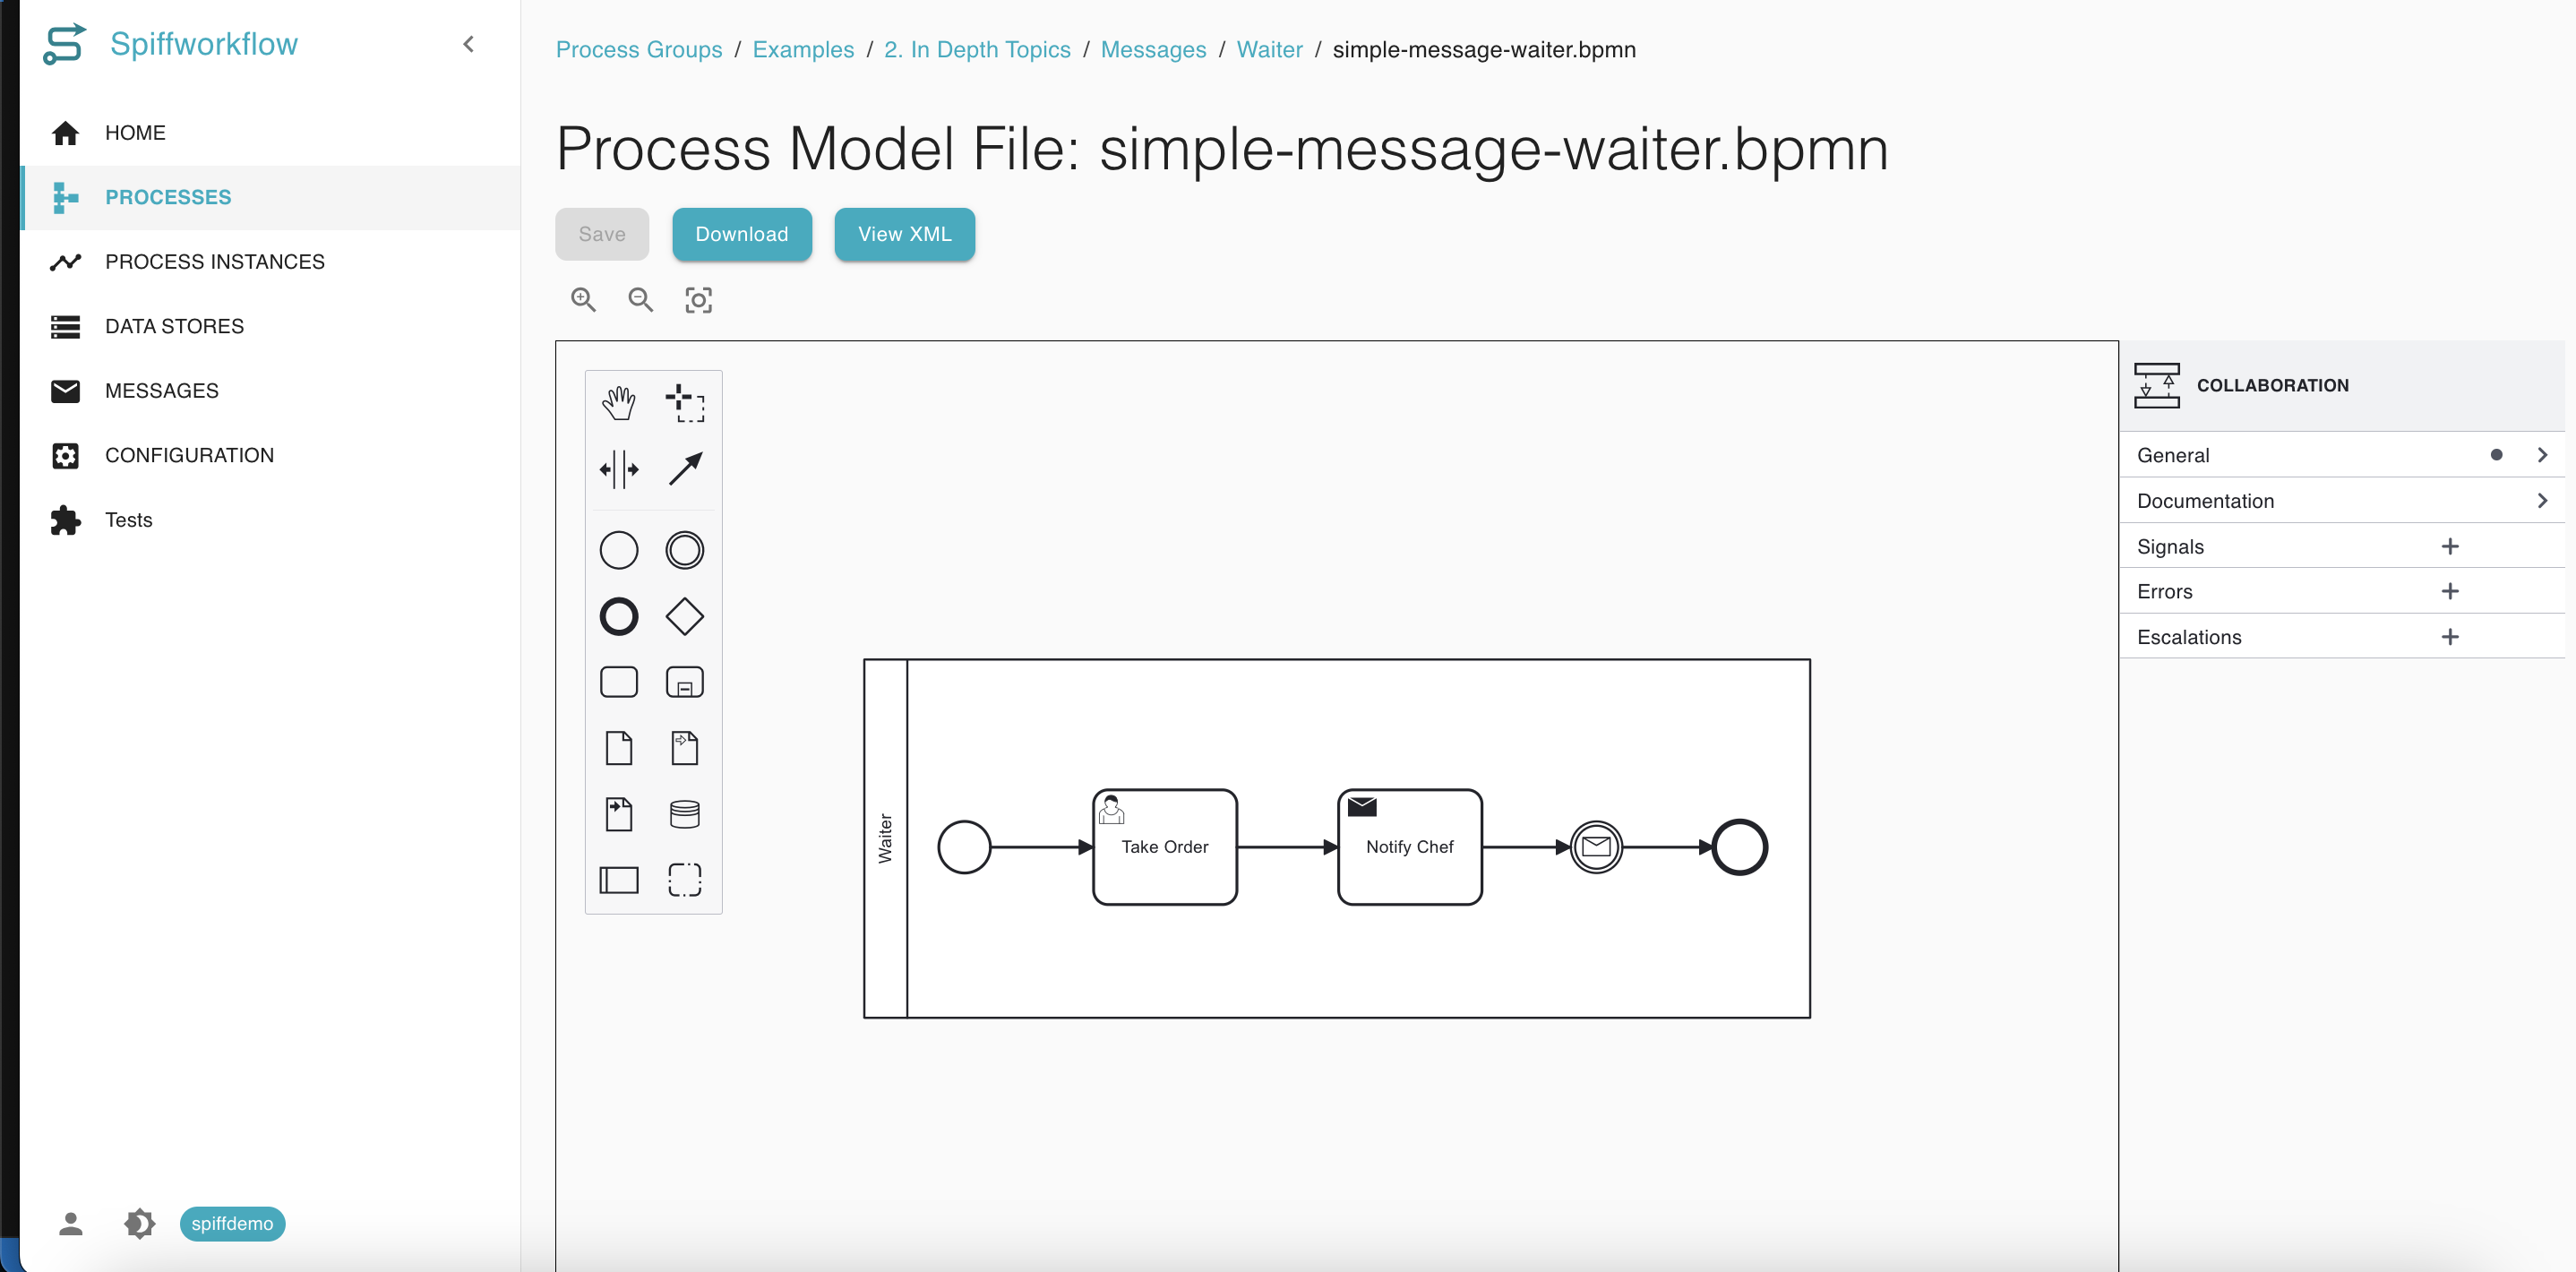
The waiter takes an order.
This order is then communicated to the chef via a message.
The waiter then waits for a response from the chef, indicating the order’s readiness.
Chef Process:
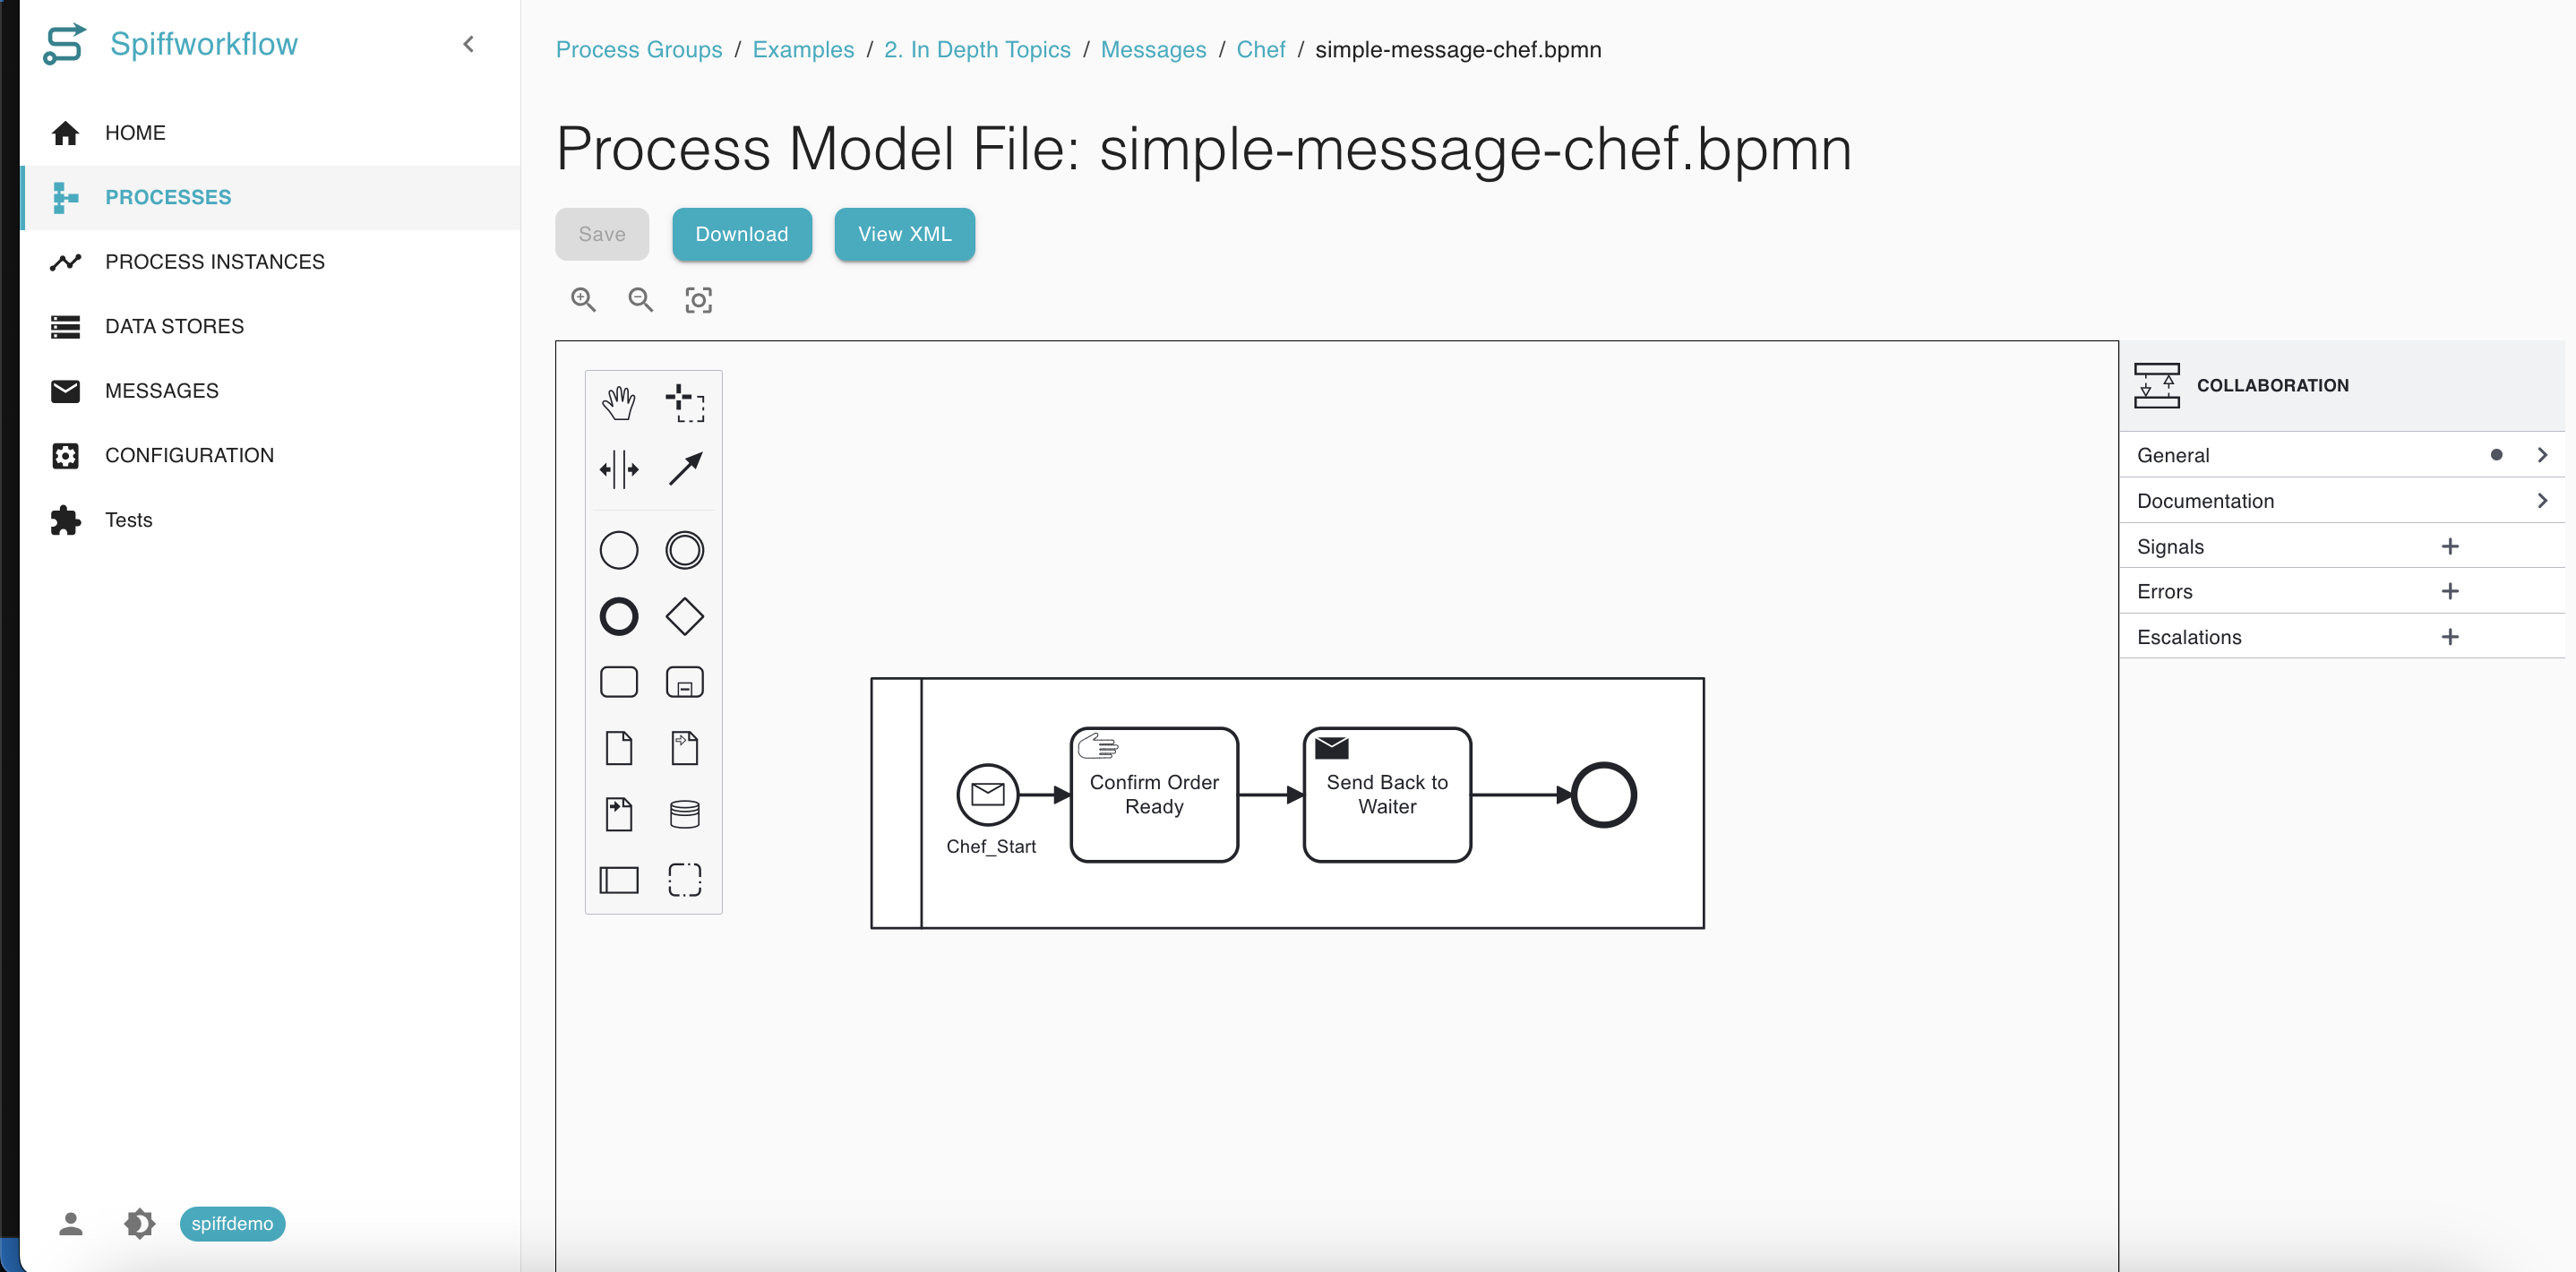
The chef starts by receiving the order message from the waiter.
After preparing the meal, the chef sends a message back to the waiter, signaling that the order is ready.
Setting Up the Processes
The setup involves creating two process models named “Chef” and “Waiter.” The waiter’s process involves taking an order, setting up variables like table number, drink, and meal, and then sending a message to the chef. The chef’s process starts by listening for the order message, preparing the meal, and then sending a confirmation message back to the waiter.
Correlation Keys and Properties
One of the complexities in BPMN messaging is ensuring that the right processes are communicating with each other, especially when multiple instances are running. This is achieved using correlation keys and properties.
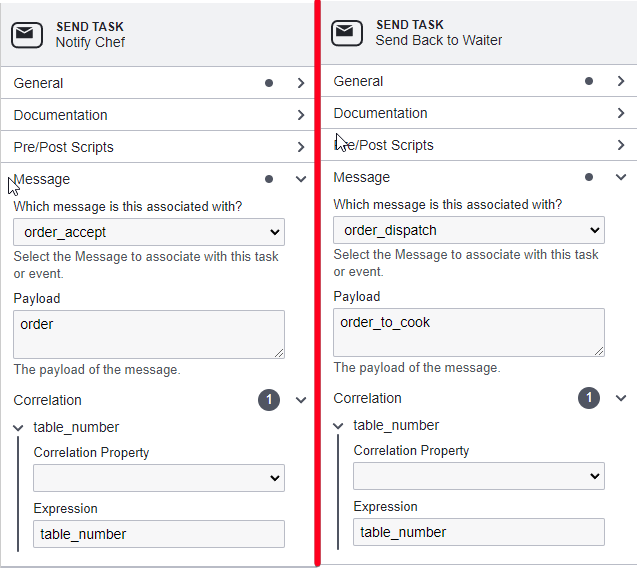
Correlation Keys: These represent the topic of the conversation. In the given example, the correlation key is the “order”.
Correlation Properties: These are unique identifiers within the conversation. In the example, the “table number” serves as the correlation property, ensuring the right waiter communicates with the right chef.
Execution and Observation
Upon executing the waiter’s process, it sends a message to the chef and waits. The chef’s process, upon receiving the message, requires user input (indicating the meal’s completion). Once the chef confirms the meal’s readiness, a message is sent back to the waiter, completing both processes.
For a more visual understanding and a step-by-step walkthrough, you can watch Dan Funk’s full tutorial here.
How to Share Process Instances with Short Links
The short link feature provides a convenient way to share process instances with others without the need to copy and paste lengthy URLs. This feature is especially useful for quick sharing via email, messaging apps, or within documentation.
To copy the short link:
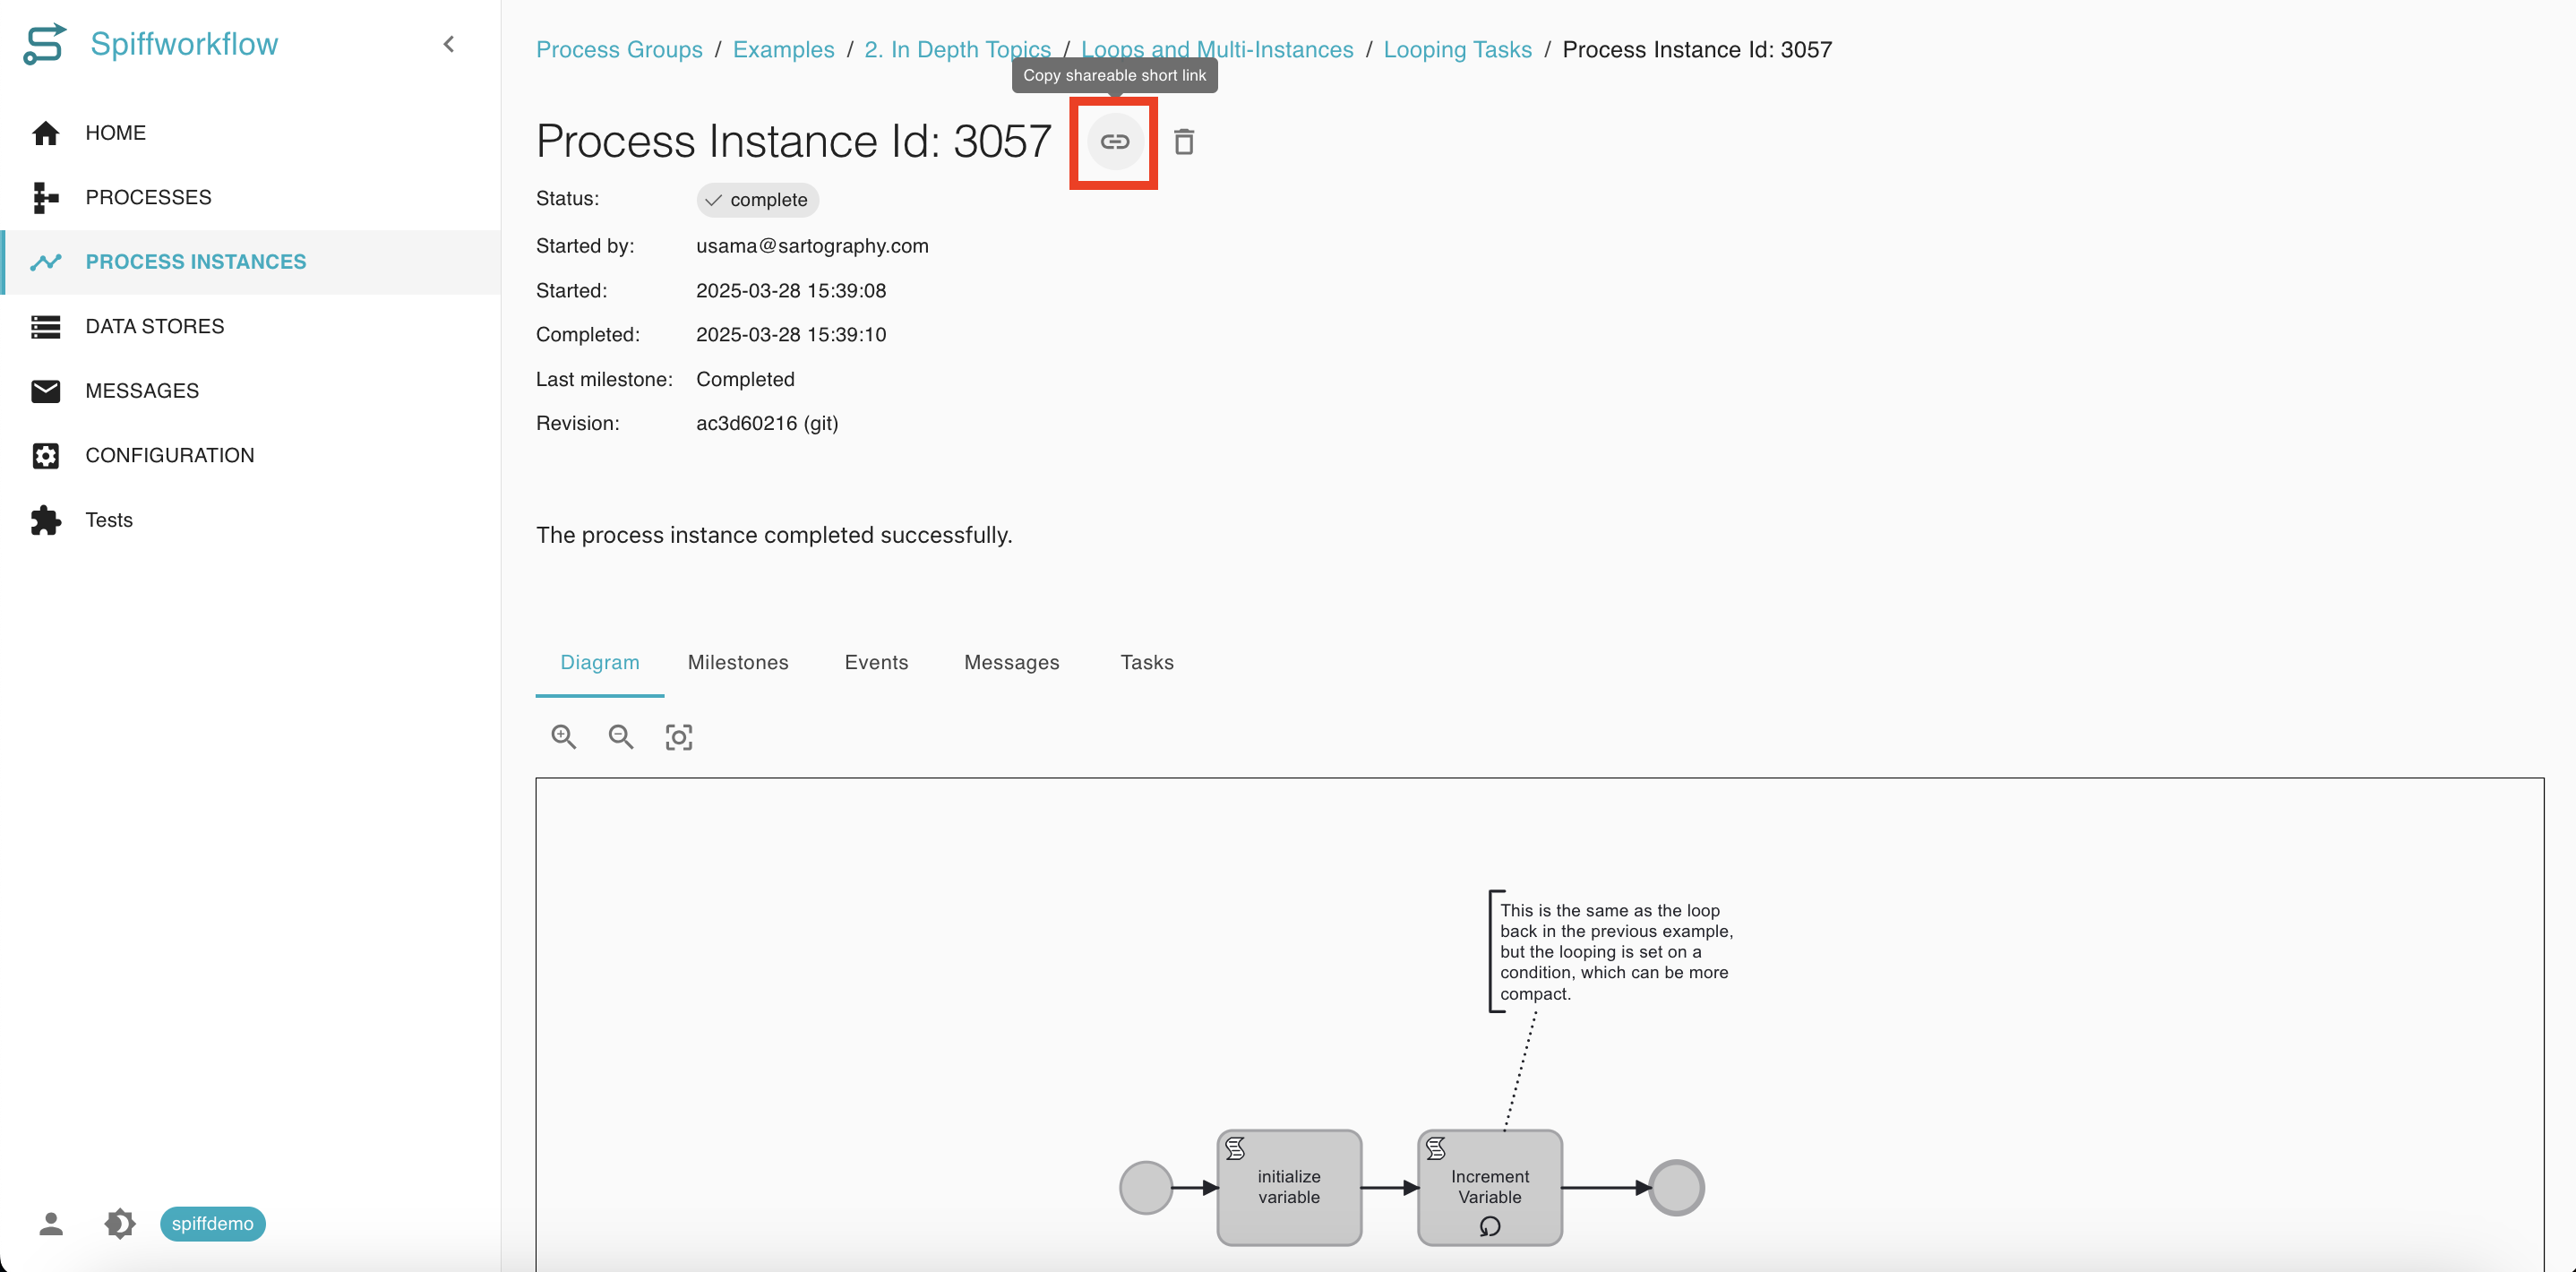
Access the Process Instance: Open the process instance that you wish to share.
Find the Short Link Icon: Look for the link icon near the process instance heading and click on the link icon to copy the short link to your clipboard automatically. Please refer to the screenshot provided.
Now, you can paste the short link into your desired communication medium to share it with others.
How to View Who Completed User Forms
To access and review completed user forms within a specific process model, follow these guidelines:
Find the ‘Tasks’ tab in the Process Instance view: Begin by going to the process instance and scrolling to locate the ‘Tasks’ tab. This area displays all user forms connected to the process.
Examine Completed Forms:
Forms You Completed: In this section, you can view the forms that you have completed. It allows you to see the specific details and inputs you provided in each task.

Forms Completed by Others: This part shows all the forms completed by any user. You can see who completed each form and the last time it was updated. However, for privacy and security reasons, you won’t be able to view the specific input details of forms completed by others.

This approach ensures you can monitor and review the progress of user forms within any process model while maintaining the confidentiality of inputs made by other users.
How to View Task Instance History
Monitoring the history of task instances is useful for tracking the progress and execution details of a workflow. This guide provides a step-by-step approach to access and understand the task instance history, including the interpretation of task statuses.
Steps to Access Task Instance History
Run the Process: Initiate a workflow process in SpiffWorkflow.
Access the Process Instance: After running the process, navigate to the specific process instance within the SpiffWorkflow interface. This is where you can track the progress of the tasks.
View Task Details: Click on the executed task or event that has been completed. For instance, in this example, we clicked on “user task”.
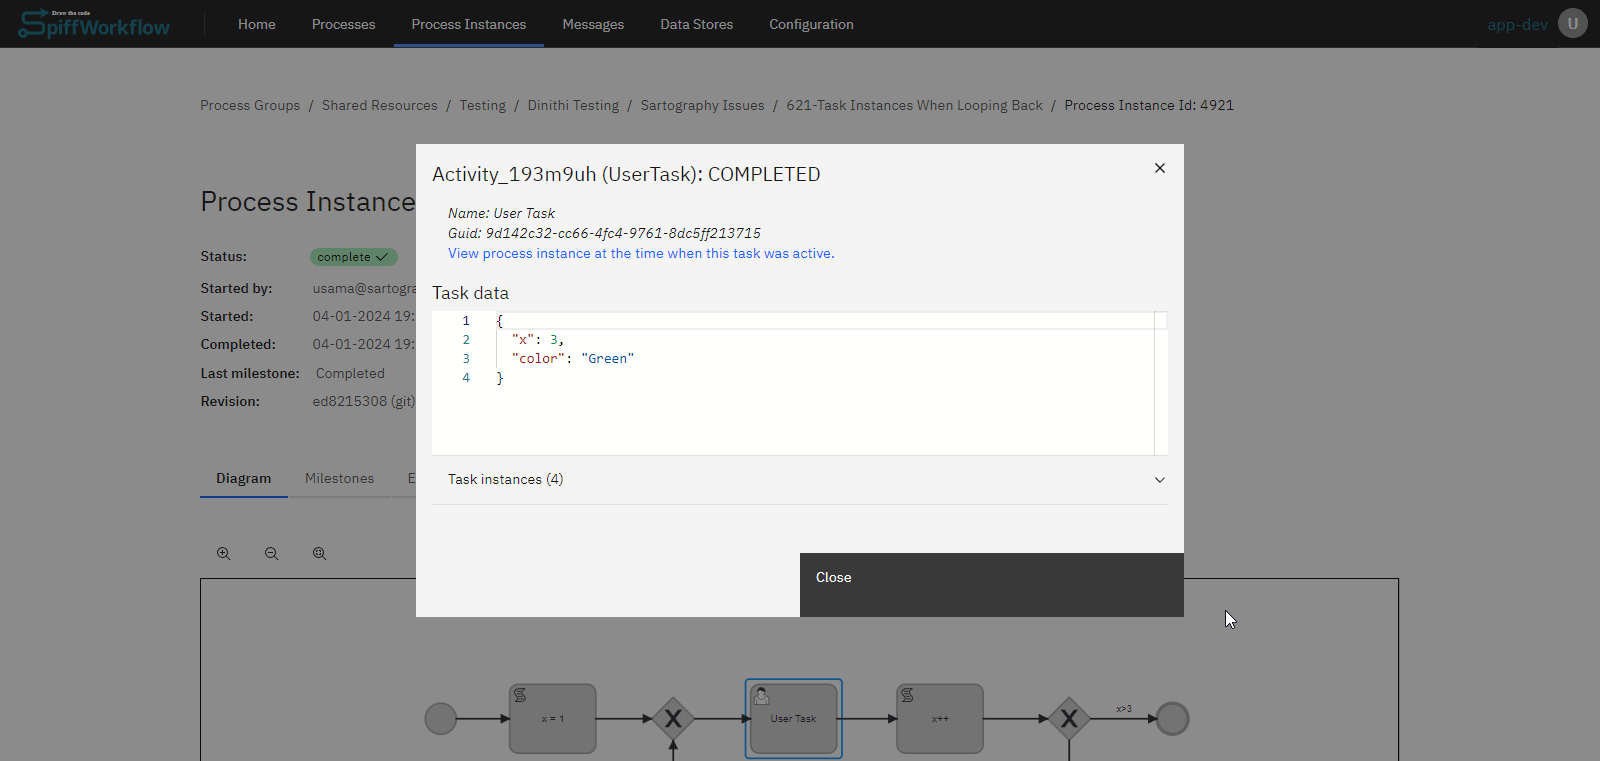
You will be presented with detailed information about each task instance, including its status and execution timestamp.
For example:
2: 04-01-2024 19:58:11 - MAYBE3: 04-01-2024 19:58:10 - COMPLETED4: 04-01-2024 19:58:07 - COMPLETED
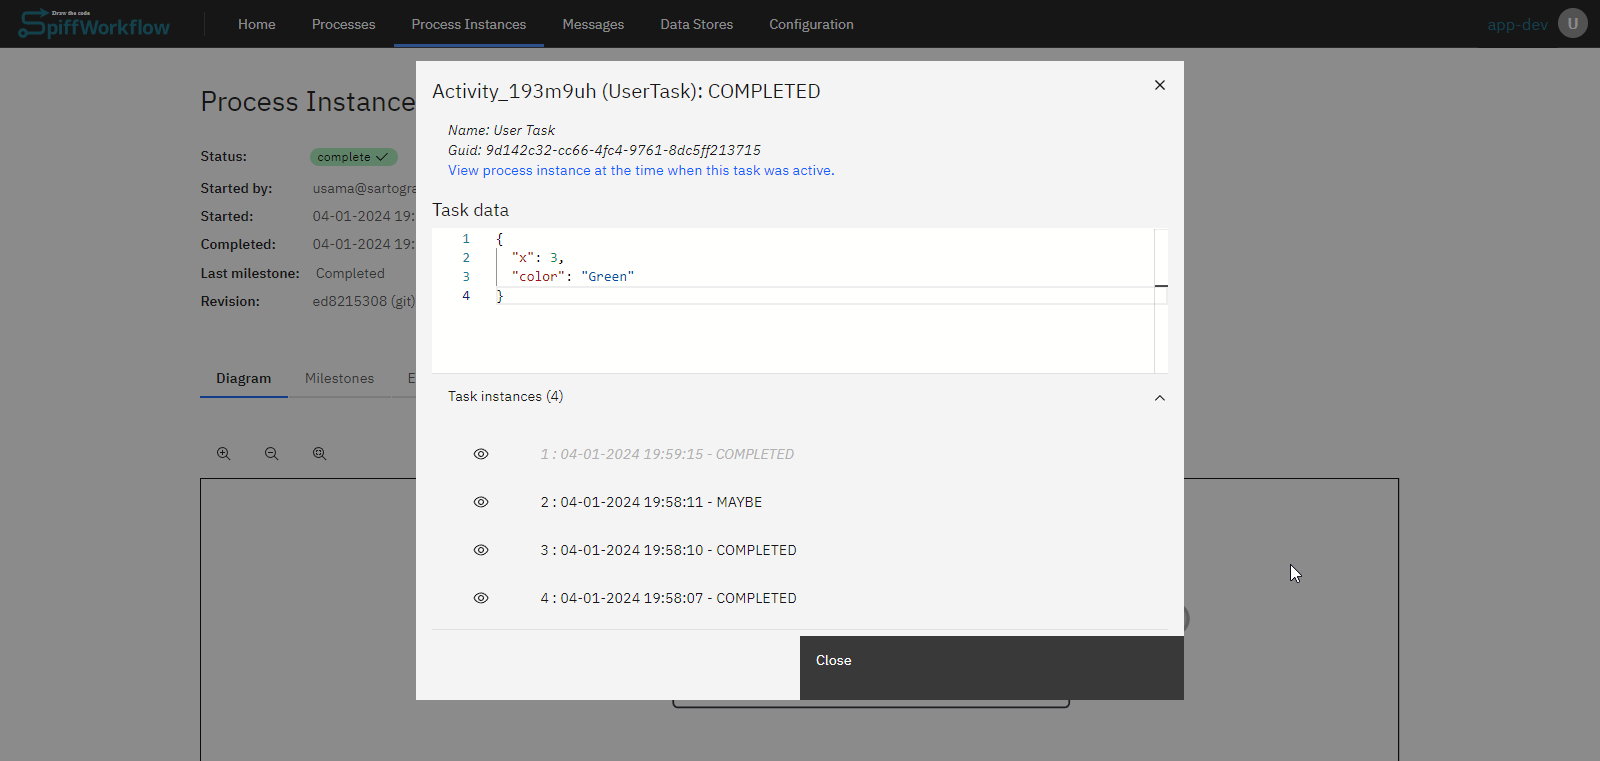
COMPLETED Status: Tasks marked as ‘COMPLETED’ have finished their execution successfully and have moved the workflow forward.
MAYBE Status: Indicates that the task still exists within SpiffWorkflow. While these tasks could be omitted for clarity, retaining them provides a complete picture of the workflow’s execution.
Viewing task instance history in SpiffWorkflow is now more streamlined and informative, thanks to recent updates. Users can effectively track each task’s execution, status, and timing, gaining insights into the workflow’s overall performance.